Statistical consulting for research teams
I help researchers turn messy data into clear models, uncertainty estimates, and results you can publish or act on.
Led by Joseph Martin, Founder & Lead Consultant.
Case studies with quantified results.
Reproducible workflows (R/Python).
Advanced analytical expertise.
Free · no prep needed.
How I Work
Intro call (20 min)
Pilot analysis (D0)
Full analysis & write-up (D1+)
Handoff
Pilot analysis (D0) — 1–2 weeks, fixed-fee.
Feasibility, early findings on your research question, and a concrete plan/quote for full analysis and reporting. Learn more on Services
After You Book
Short intake form.
20-min call to clarify goals & data reality.
If there’s a fit, I’ll propose a fixed-fee pilot analysis (D0).
Data is de-identified by default. Nothing shared without permission. Read Full Policy
Case Studies
Selected applied research projects across clinical risk, geospatial access, behavioral bias, pay equity, and advanced methods. Some examples use anonymized, simulated, or publicly available data, but all reflect the same workflows I use in real collaborations.Don’t see what you need? Let's talk →
Reverse Engineering Laser Systems
At a glance: ~95% re-sim agreement with target energy metrics; no brute-force search.
Outcome: Inverse model that recovers viable laser parameter sets for target spectra, enabling faster experimental design and design-space exploration; developed in collaboration with The Ohio State University under National Science Foundation support.
View case study →
Advanced Methods · Invertible neural networks
Diaper Access Planning
At a glance: ~50% of target population within 30-min walk; ~30% county reach by 30-min bus.
Outcome: Data-backed candidate hub location near an intercity transit stop, with documented access metrics for equitable service planning.
View case study →
Geospatial · K-means clustering + GIS
Surgical Risk Prediction
At a glance: BMI up to ~17× odds of leak (logistic model).
Outcome: Clinically interpretable leak-risk estimates by BMI band and covariates, supporting pre-op planning and future validation work.
View case study →
Healthcare · Logistic regression
Umpire Bias in Strike Calls
At a glance: +12 percentage points strike calls at 3-ball counts; –24 percentage points at two strikes (relative to ~47% baseline).
Outcome: Quantified count-state bias in borderline strike calls, with a modeling framework that generalizes to other human-in-the-loop decisions.
View case study →
Behavioral · Logistic regression (marginal effects)
Error Modeling (High-Velocity Tracking)
At a glance: Mean error ~0.5 m; interval estimates from 0.1–8 km.
Outcome: Distance-specific prediction intervals characterizing tracking error from 0.1–8 km, informing tuning and safe operating ranges.
View case study→
Advanced Methods · Kernel regression + bootstrap intervals
Gender Pay Equity Analysis
At a glance: $14,280 average pay gap; adjusted model shows persistent gap by role & tenure.
Outcome: Evidence of a persistent adjusted gap by role and tenure, plus a reproducible workflow for ongoing monitoring.
View case study →
Equity · Randomization test + regression
About Martin Data Works LLC
Hi, I’m Joseph Martin. I help researchers and research-focused organizations make sense of imperfect data. My work spans pay-equity analysis, clinical risk prediction, geospatial access planning, behavioral bias modeling, and inverse-problem modeling for scientific research.
Principles:
Clarity over complexity: plain-language summaries with quantified uncertainty.
Reproducible by default: versioned notebooks, documented assumptions.
Right-sized solutions: models that match the research question, not the syllabus.
Data ethics & privacy: de-identification first, least-access needed.
How I Work
1. Intro call (20 min)
Goals, stakes, data reality.
No prep needed; quick fit check.
2. Pilot analysis (D0)
1–2 weeks, fixed‑fee: data intake & feasibility, early findings on your research question, and a proposed analysis approach.
Summary brief + plan/quote for D1+.
3. Full analysis & reporting (D1+)
Analysis/modeling with review checkpoints and agreed-upon deliverables.
Written summaries and visuals that document results and key trade-offs.
4. Handoff
Reproducible code/notebooks, visuals, and a “what to monitor next” note.
Optional support window.
Pilot analysis (D0) details on the Services page. →
Experience Highlights
NSF-funded research collaboration in statistical modeling.
Applied data science to nonprofit resource planning.
Presented applied work at academic conferences.
Advanced training in Mathematics and Statistics.
Tooling
R, Python, tidyverse, scikit-learn, Quarto/Markdown, Git, SQL.
Data handling approach and retention are outlined here: Data & Privacy
Services
I offer practical statistical support for research teams that need clarity—not complexity. Whether you’re designing a study, validating fairness, forecasting outcomes, or planning how to allocate resources, I help turn imperfect data into interpretable results.
How I Work (at a glance)
Intro call (20 min)
Pilot analysis (D0)
Full analysis & reporting (D1+)
Handoff
Pilot analysis (D0) — 1–2 weeks, fixed-fee.
Feasibility, early findings on your research question, and a concise summary plus plan/quote for full analysis.
Outcome Modeling & Scenario Analysis
Good for: “Which variables are associated with this outcome?” “What happens if we change X?”
Deliverables: effect estimates and elasticities, scenario ranges, plain-language summary, reproducible notebook.
Technical Collaboration (Research & Prototyping)
Good for: Inverse problems, experimental design, method validation, and statistical modeling for research labs.
Deliverables: reproducible code, experiment/analysis plan, and an evaluation report suitable for methods or results sections.
Geospatial & Access Planning
Good for: site selection, resource placement, and access/equity analysis.
Deliverables: maps, clustering rationale, access metrics, and candidate site recommendations.
Pay Equity & Fairness Analysis
Good for: internal compensation studies, equity reviews, and fairness-focused research.
Deliverables: methodology memo, effect sizes with uncertainty, and evidence-based options for addressing observed gaps.
How I Work — full process
1. Intro call (20 min)
Goals, stakes, data reality.
No prep needed; quick fit check.
2. Pilot analysis (D0)
1–2 weeks, fixed-fee: data intake & feasibility, early findings on your research question, and a proposed analysis approach.
Summary brief + plan/quote for D1+.
3. Full analysis & reporting (D1+)
Analysis/modeling with review checkpoints and agreed-upon deliverables.
Plain-language summaries with uncertainty ranges.
Written reports and visuals that lay out results and key trade-offs.
4. Handoff
Reproducible code/notebooks, visuals, and a “what to monitor next” note.
Optional support window.
See Data & Privacy for access, retention, and NDA details.
Contact
Have a research question or dataset you’re wrestling with? I’m happy to take a look.
Free · no prep needed.
After You Book
Short intake form.
20-min call to clarify goals, research context, and data reality.
If there’s a fit, I’ll propose a fixed-fee pilot analysis (D0).
Data & NDA
No prep is needed for the intro call. If we move forward—or if you already have materials ready—I’ll provide a secure upload link. Please avoid sending PHI/PII or other regulated data via email or the form. I'm happy to review and execute an NDA or data use agreement.
Response time: I typically reply within 1 business day.If you don’t hear back, email me directly at [email protected]
Data is de-identified by default. Nothing shared without permission. Read Full Policy
Data & Privacy
This page summarizes how I handle data access, security, and retention during and after a project. I’m happy to align to reasonable institutional / client policies and to sign your NDA.
Principles:
De‑identification first: remove direct identifiers where feasible; prefer aggregates and sampling for initial pilot analyses.
Minimum‑necessary access: start read‑only; least‑privilege principles.
Secure transfer: SFTP/SharePoint/Drive links provided; avoid email attachments with sensitive data.
Reproducibility: version‑controlled code/notebooks; assumptions documented.
Confidentiality: nothing shared outside your org without written permission.
Access & Security
Access is scoped to project needs and revoked at close.
Credentials are stored in approved password managers only (no plaintext).
Multi‑factor authentication used where supported.
NDAs & Agreements
Happy to review and execute an NDA (or data use agreement) prior to receiving materials.
Statements of Work document acceptance criteria and deliverables.
Data Retention & Deletion
Unless otherwise required, project data is deleted or returned within 30 days of project close, unless otherwise agreed in writing.
Logs and derived, non‑identifying artifacts (e.g., code templates) may be retained.
Compliance Note
I do not operate as a covered entity. HIPAA/PHI handling is only supported with appropriate agreements and client‑approved secure environments.
Questions about data handling or NDAs? Contact me · Book a 20-min intro call
Umpire Bias in the Judgment Zone — Effects by Count State
Outcome
Evidence that borderline strike calls are systematically shifted by count state: more balls → higher strike likelihood; more strikes → lower strike likelihood. These effects are large enough to change at-bat outcomes in aggregate and are presented with clear, interpretable deltas from the baseline ~47% strike rate in the judgment zone.
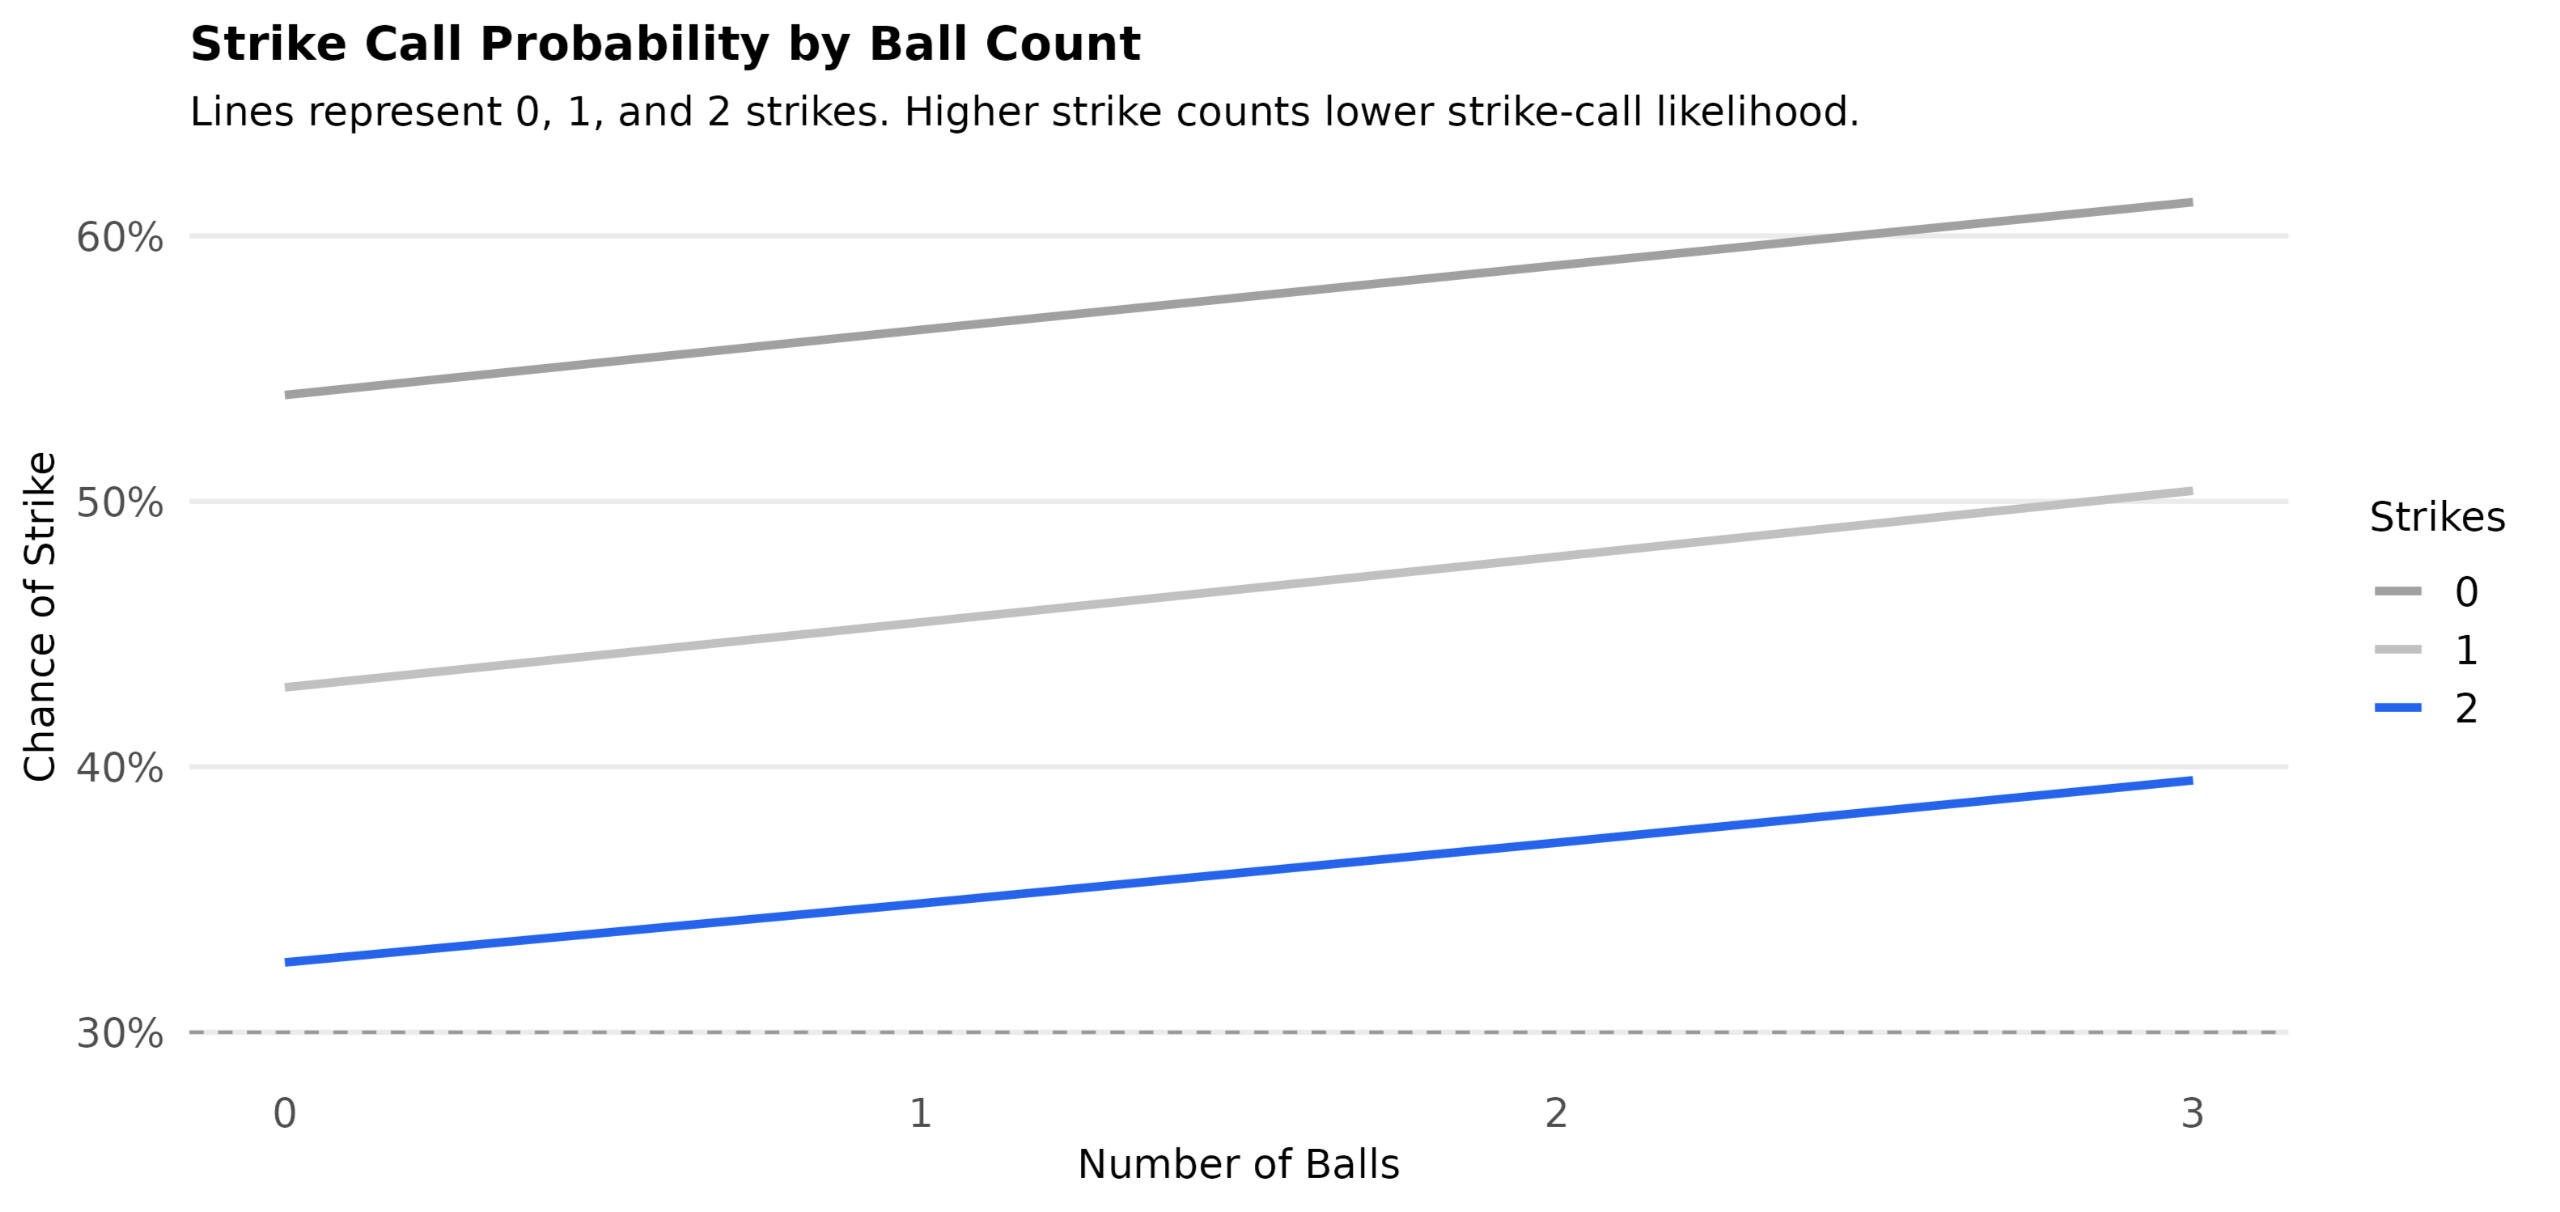
Figure 1 — Strike probability by ball count, stratified by strike count
At two strikes (blue line), umpires are significantly less likely to call a strike, while chances steadily increase with number of balls (horizontal axis).
Research question
Do umpires adjust borderline strike calls based on the current count (balls/strikes), and by how much, relative to a neutral baseline?
Approach
Fit a logistic regression on judgment-zone pitches (just in/out of the rulebook zone).
Predict strike-call probabilities across all ball × strike states; report changes vs. baseline.
Emphasize count effects (balls, strikes) while holding location at “borderline” and controlling for nuisance factors where available.
Technical note: Logit link; coefficients summarized as percentage-point deltas from the judgment-zone baseline. Robust SEs; marginal effects computed for each count. Results shown as partial-dependence curves and bar-chart deltas.
Findings
Ball count effect:
Each additional ball increases strike probability by ≈ +2.5 percentage points (typically +1 to +4).
At 3 balls, probability can rise by ≈ +12 percentage points vs baseline.
Strike count effect:
Each additional strike decreases strike probability by ≈ −11 percentage points (typically −12 to −9).
At 2 strikes, the reduction can reach ≈ −24 percentage points.
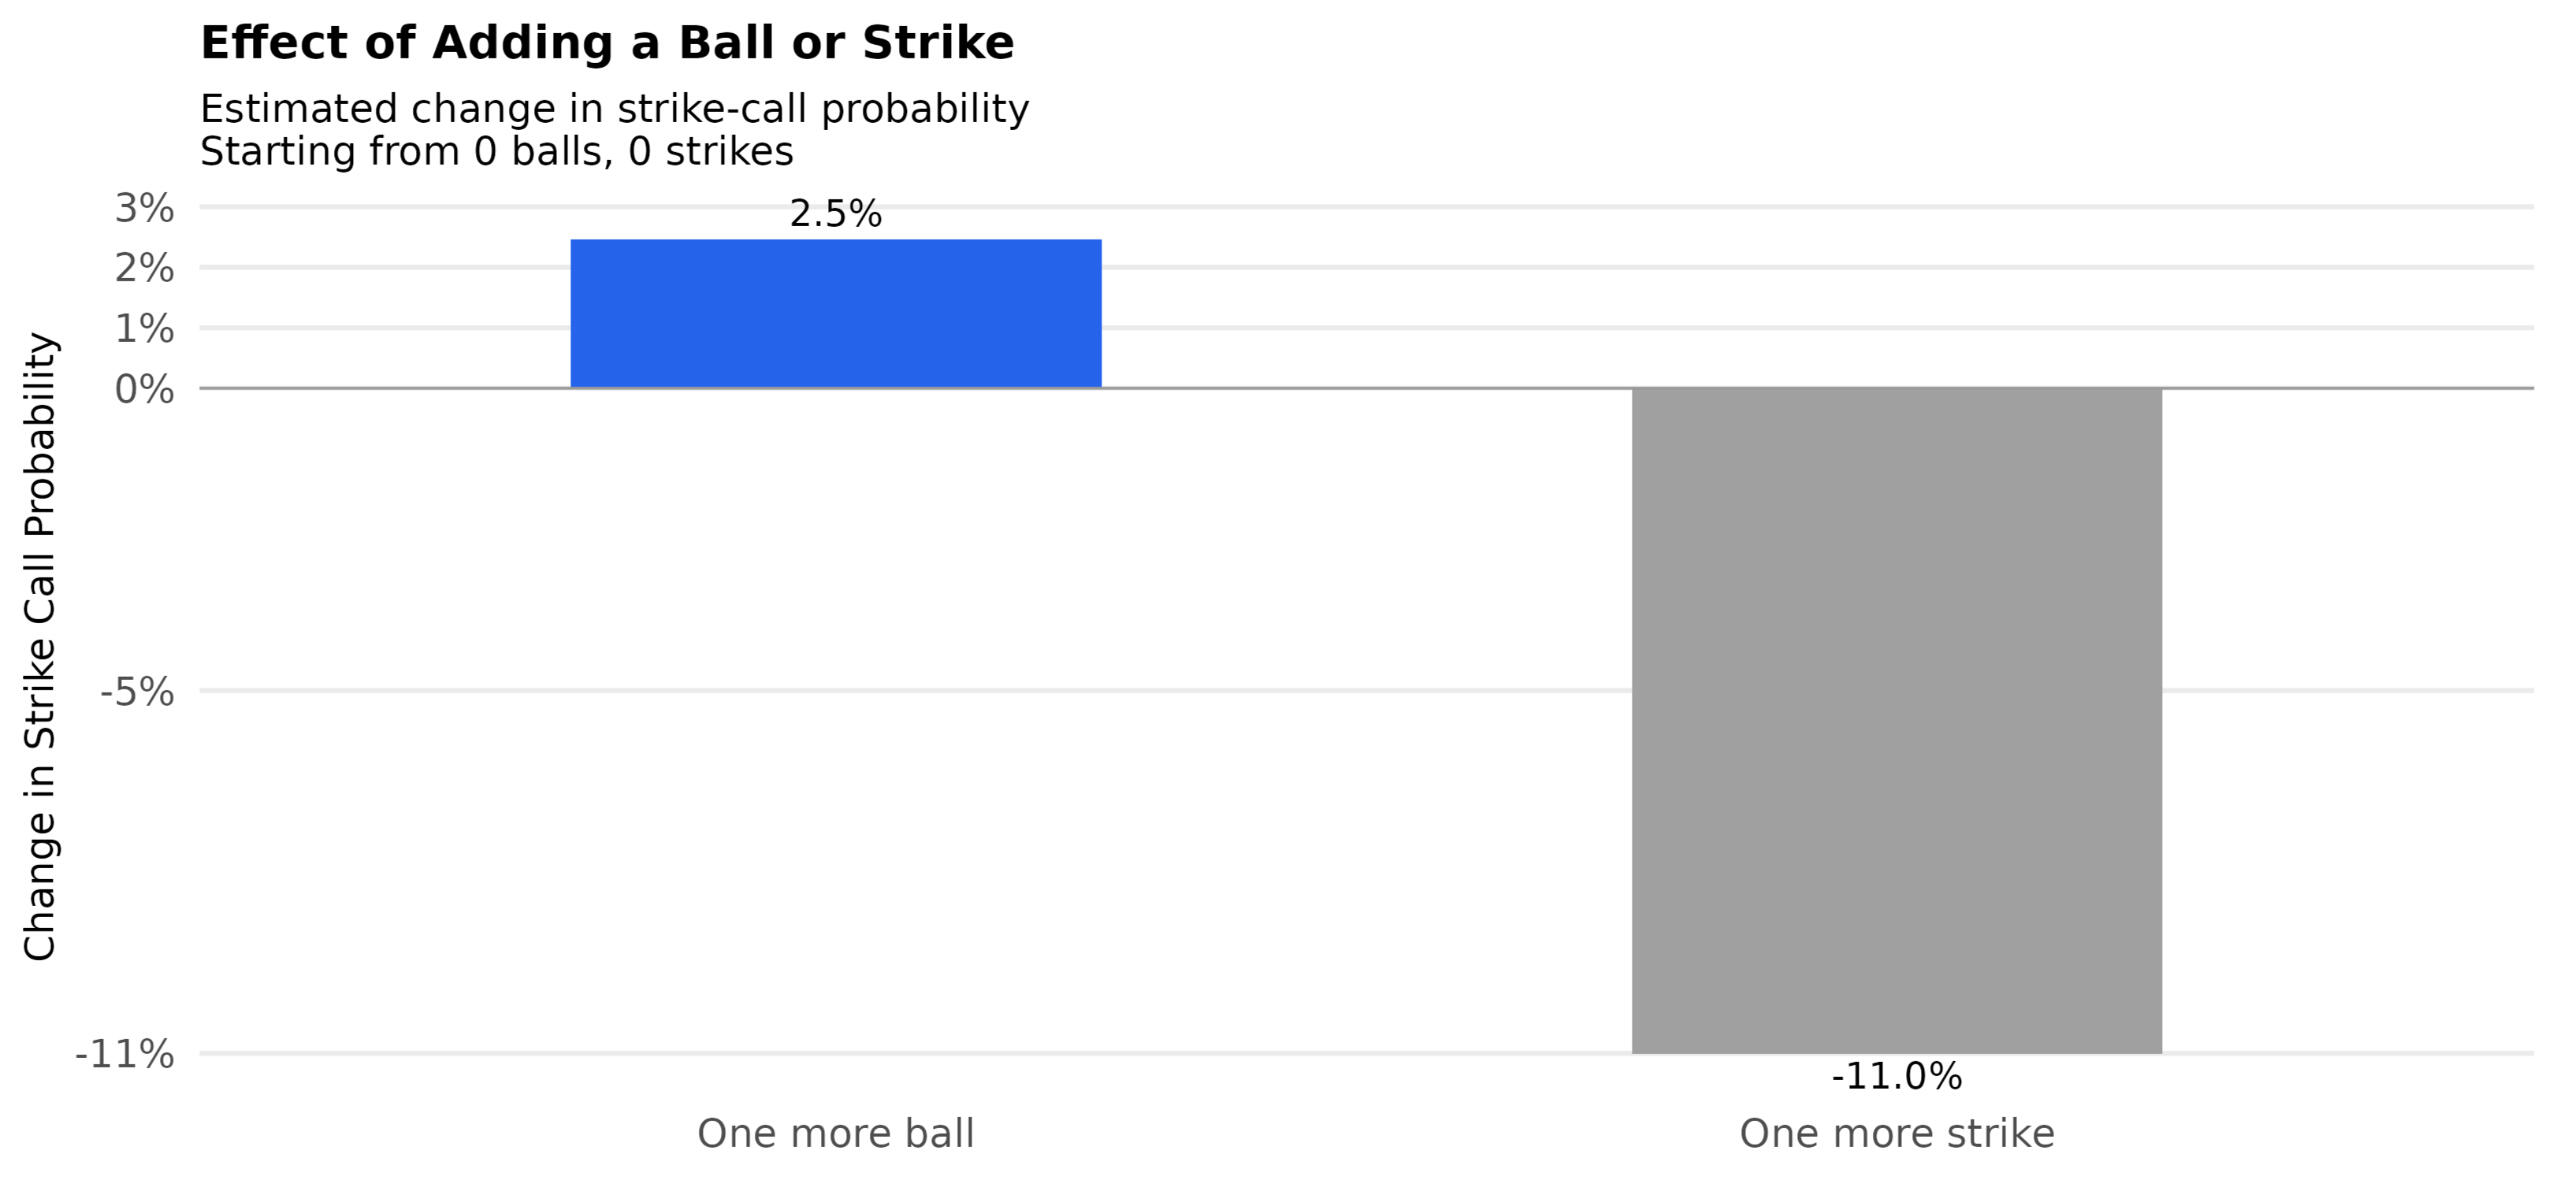
Figure 2 — Marginal effects: +1 ball vs +1 strike
One additional ball increases the strike‐call probability by +2.5 percentage points, whereas one additional strike decreases the strike‐call probability by −11.0 percentage points (baseline: 0 balls, 0 strikes).
Interpretation: patterns are consistent with contextual bias—a tendency to “restore balance”: more lenient toward pitchers in high-ball counts and toward batters in high-strike counts.
Project context
Type: Independent applied research. Role: Lead analyst. Designed as a reproducible analysis. For client work, your data and artifacts remain yours and are never shared externally; no PII is required for this analysis. Access is read-only
For similar projects, I usually start with a brief intro call and a small pilot analysis. How I Work
Free · no prep needed.
Gender Pay Equity Analysis
Outcome
Confirmed a material gender pay gap: raw average difference $14,280. After adjusting for role, level, tenure, and department, a statistically significant gap persisted, concentrated in specific role–tenure bands.
Research Question
Is there evidence of a gender pay gap in this salary data—or could the observed difference be explained by random variation?
Approach
Randomization test to estimate how often a gap this large appears if pay were truly equal.
Adjusted model controlling for role, level, tenure, department to separate composition from pay effects.
Technical note: permutation resampling for the null; OLS with HC3 SEs; cluster-robust option if needed.
Findings
Observed (raw) gap: males earned $14,280 more on average.
Likelihood under equal pay: ~1.4%, empirical p ≈ 0.014.
Adjusted estimate: statistically significant gap remains after controlling for role, level, tenure, and department.
Concentration: gap is largest in specific role–tenure bands and a small set of departments
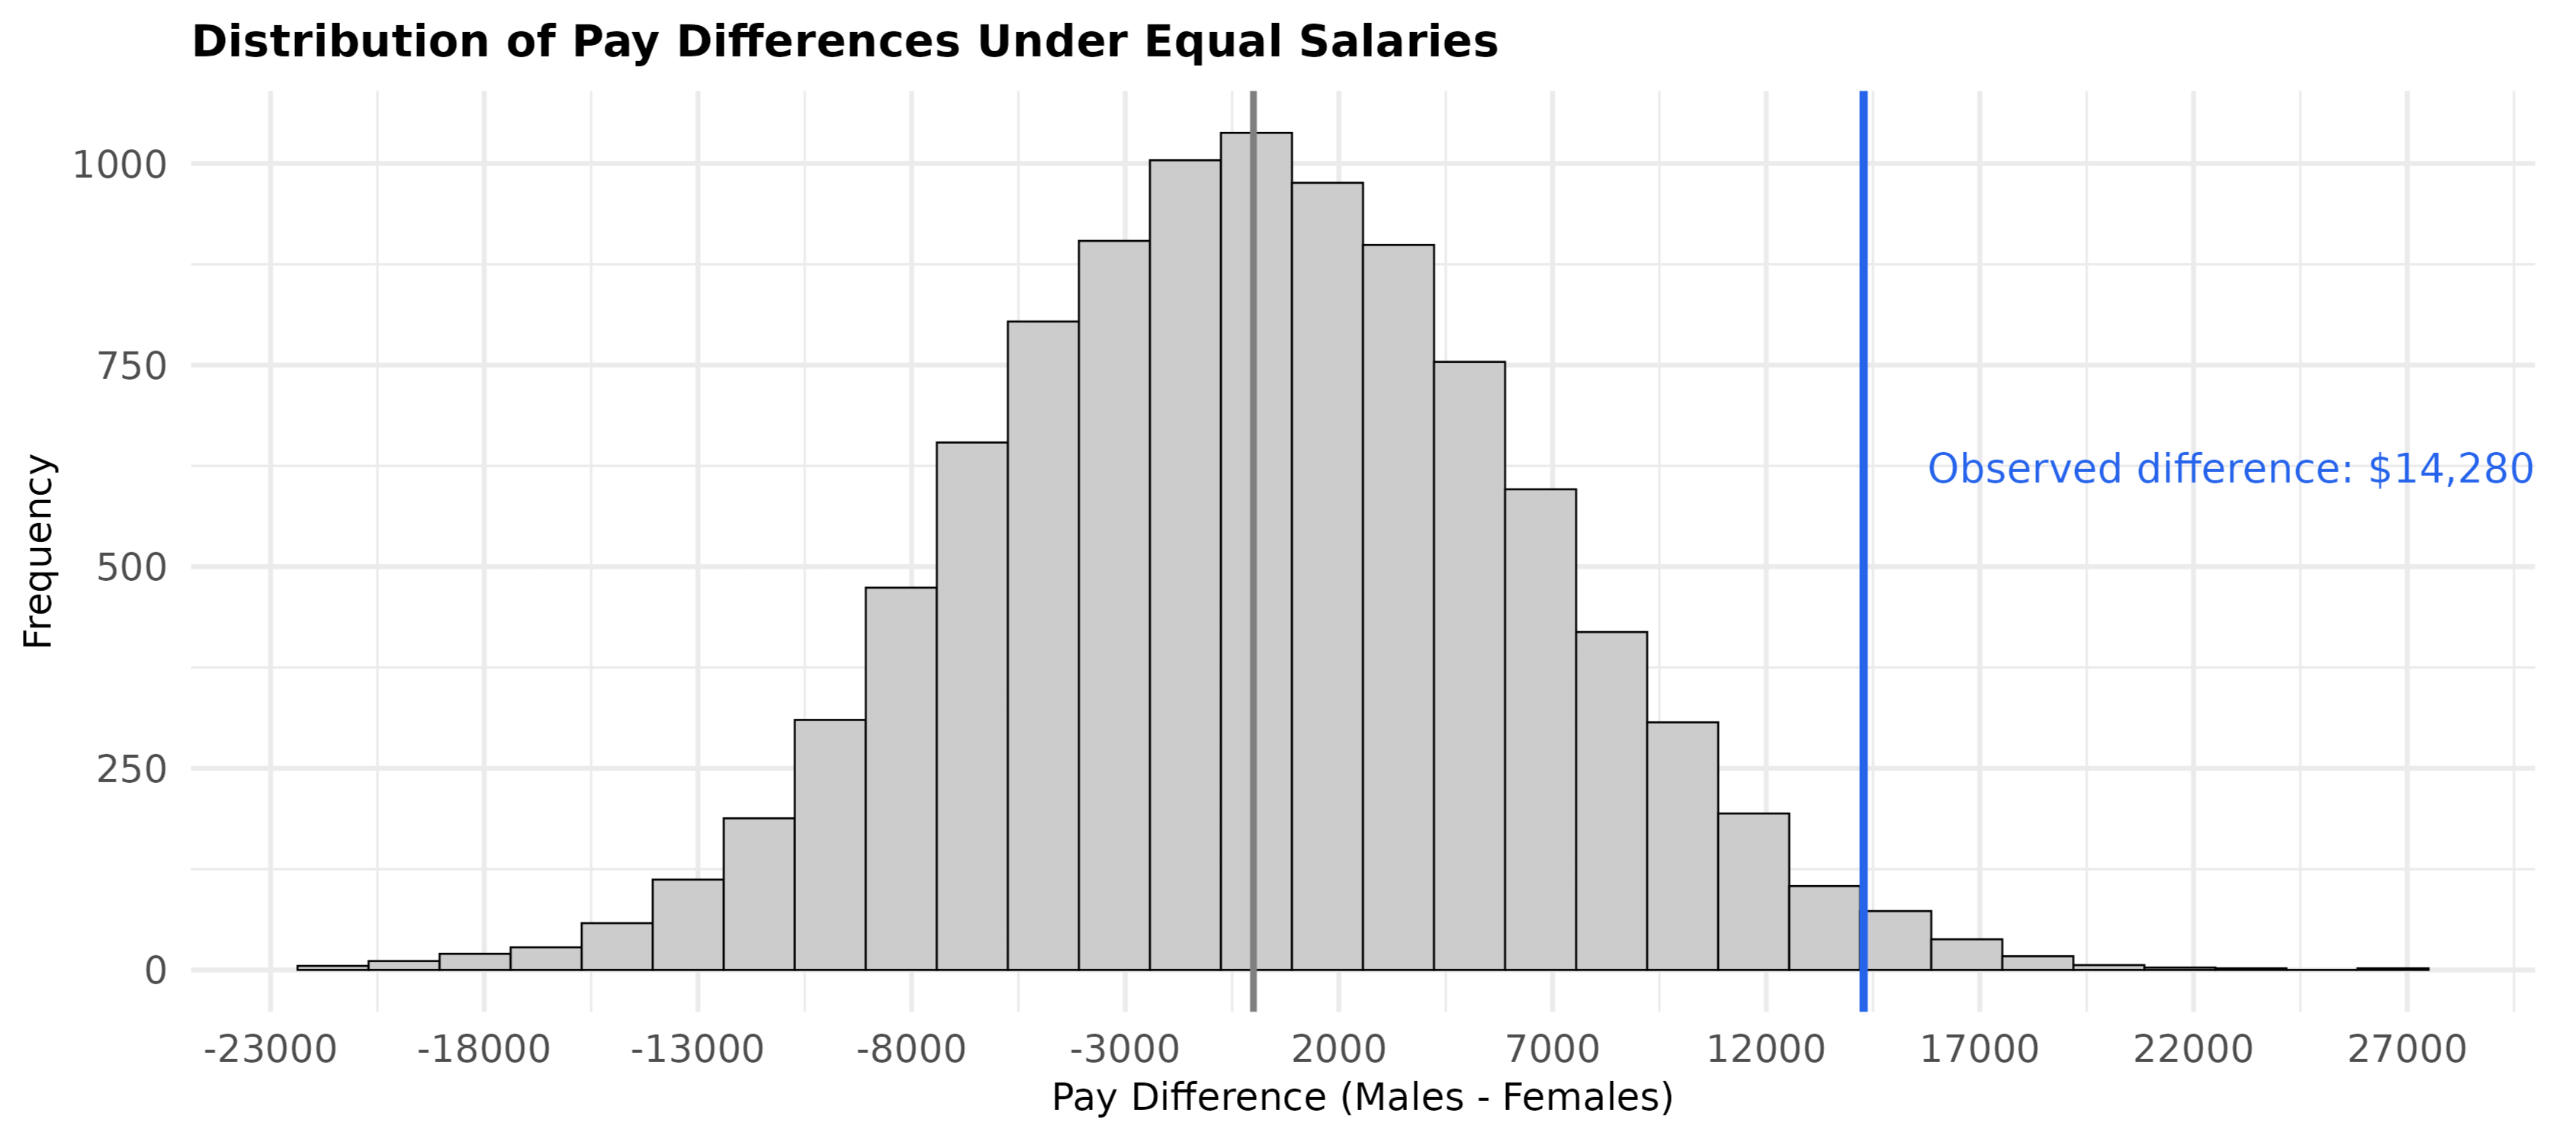
Figure 1 — Randomization distribution of pay gaps under equal pay
A histogram of permuted pay differences with the observed gap marked. Only ~1.4% of null resamples exceed the observed gap.
Interpretation: the pattern is unlikely to be random: if pay were truly equal, a gap this large would appear only ~1.4% of the time by chance. The adjusted model indicates a persistent gap after accounting for role and tenure. Future work could focus on understanding the mechanisms behind these disparities and evaluating potential interventions.
Project context
Type: Independent applied research. Role: Lead analyst. Designed as a reproducible analysis. For client work, your data and artifacts remain yours and are never shared externally; no PII is required for this analysis. Access is read-only
For similar projects, I usually start with a brief intro call and a small pilot analysis. How I Work
Free · no prep needed.
Colectomy: Predicting Anastomotic Leak Risk
Outcome
An interpretable, publication-ready risk model for anastomotic leak after colectomy that surfaces BMI category as a dominant driver while retaining clinically important covariates. The model supports surgical planning (optimization, counseling, monitoring level) and could be implemented as a bedside risk calculator or decision-support tool with defensible odds ratios and clear uncertainty.
Research question
Can we provide reliable patient-level risk estimates for anastomotic leak—prior to surgery—that clinicians can trust and explain, with BMI handled using standard clinical bands?
Approach
Fit a transparent logistic regression to a cohort of n = 180 colectomy patients.
Predictors: BMI (clinical categories), age, serum albumin, operative duration, tobacco use, gender, and comorbidities.
Categorical BMI bands (Underweight → Obese III) to align with clinical publishing norms and bedside interpretability.
Report odds ratios (ORs) with 95% CIs; profile-likelihood intervals where separation risk appears.
Two worked patient profiles illustrate risk shifts across BMI categories (healthy vs high-risk).
Technical note: OLS analogy avoided; canonical logit link. Multicollinearity checks; robust SEs. Underweight had no observed leaks (non-estimable OR → marked explicitly). Model intended for calibration checks and bootstrap validation in D1+.
Findings
BMI is a strong predictor.
Obese III: ~17× higher odds vs Normal BMI.
Overweight: ~5× higher odds vs Normal.
Underweight: no leaks observed → not estimable.
Other significant covariates:
Age: ~10% higher odds per additional year (p = 0.001).
Albumin: ~78% lower odds per +1 g/dL (p = 0.004).
Operative time: ~40% higher odds per +1 hour (p = 0.043).
Tobacco use and gender increased odds but were not statistically definitive in this sample.
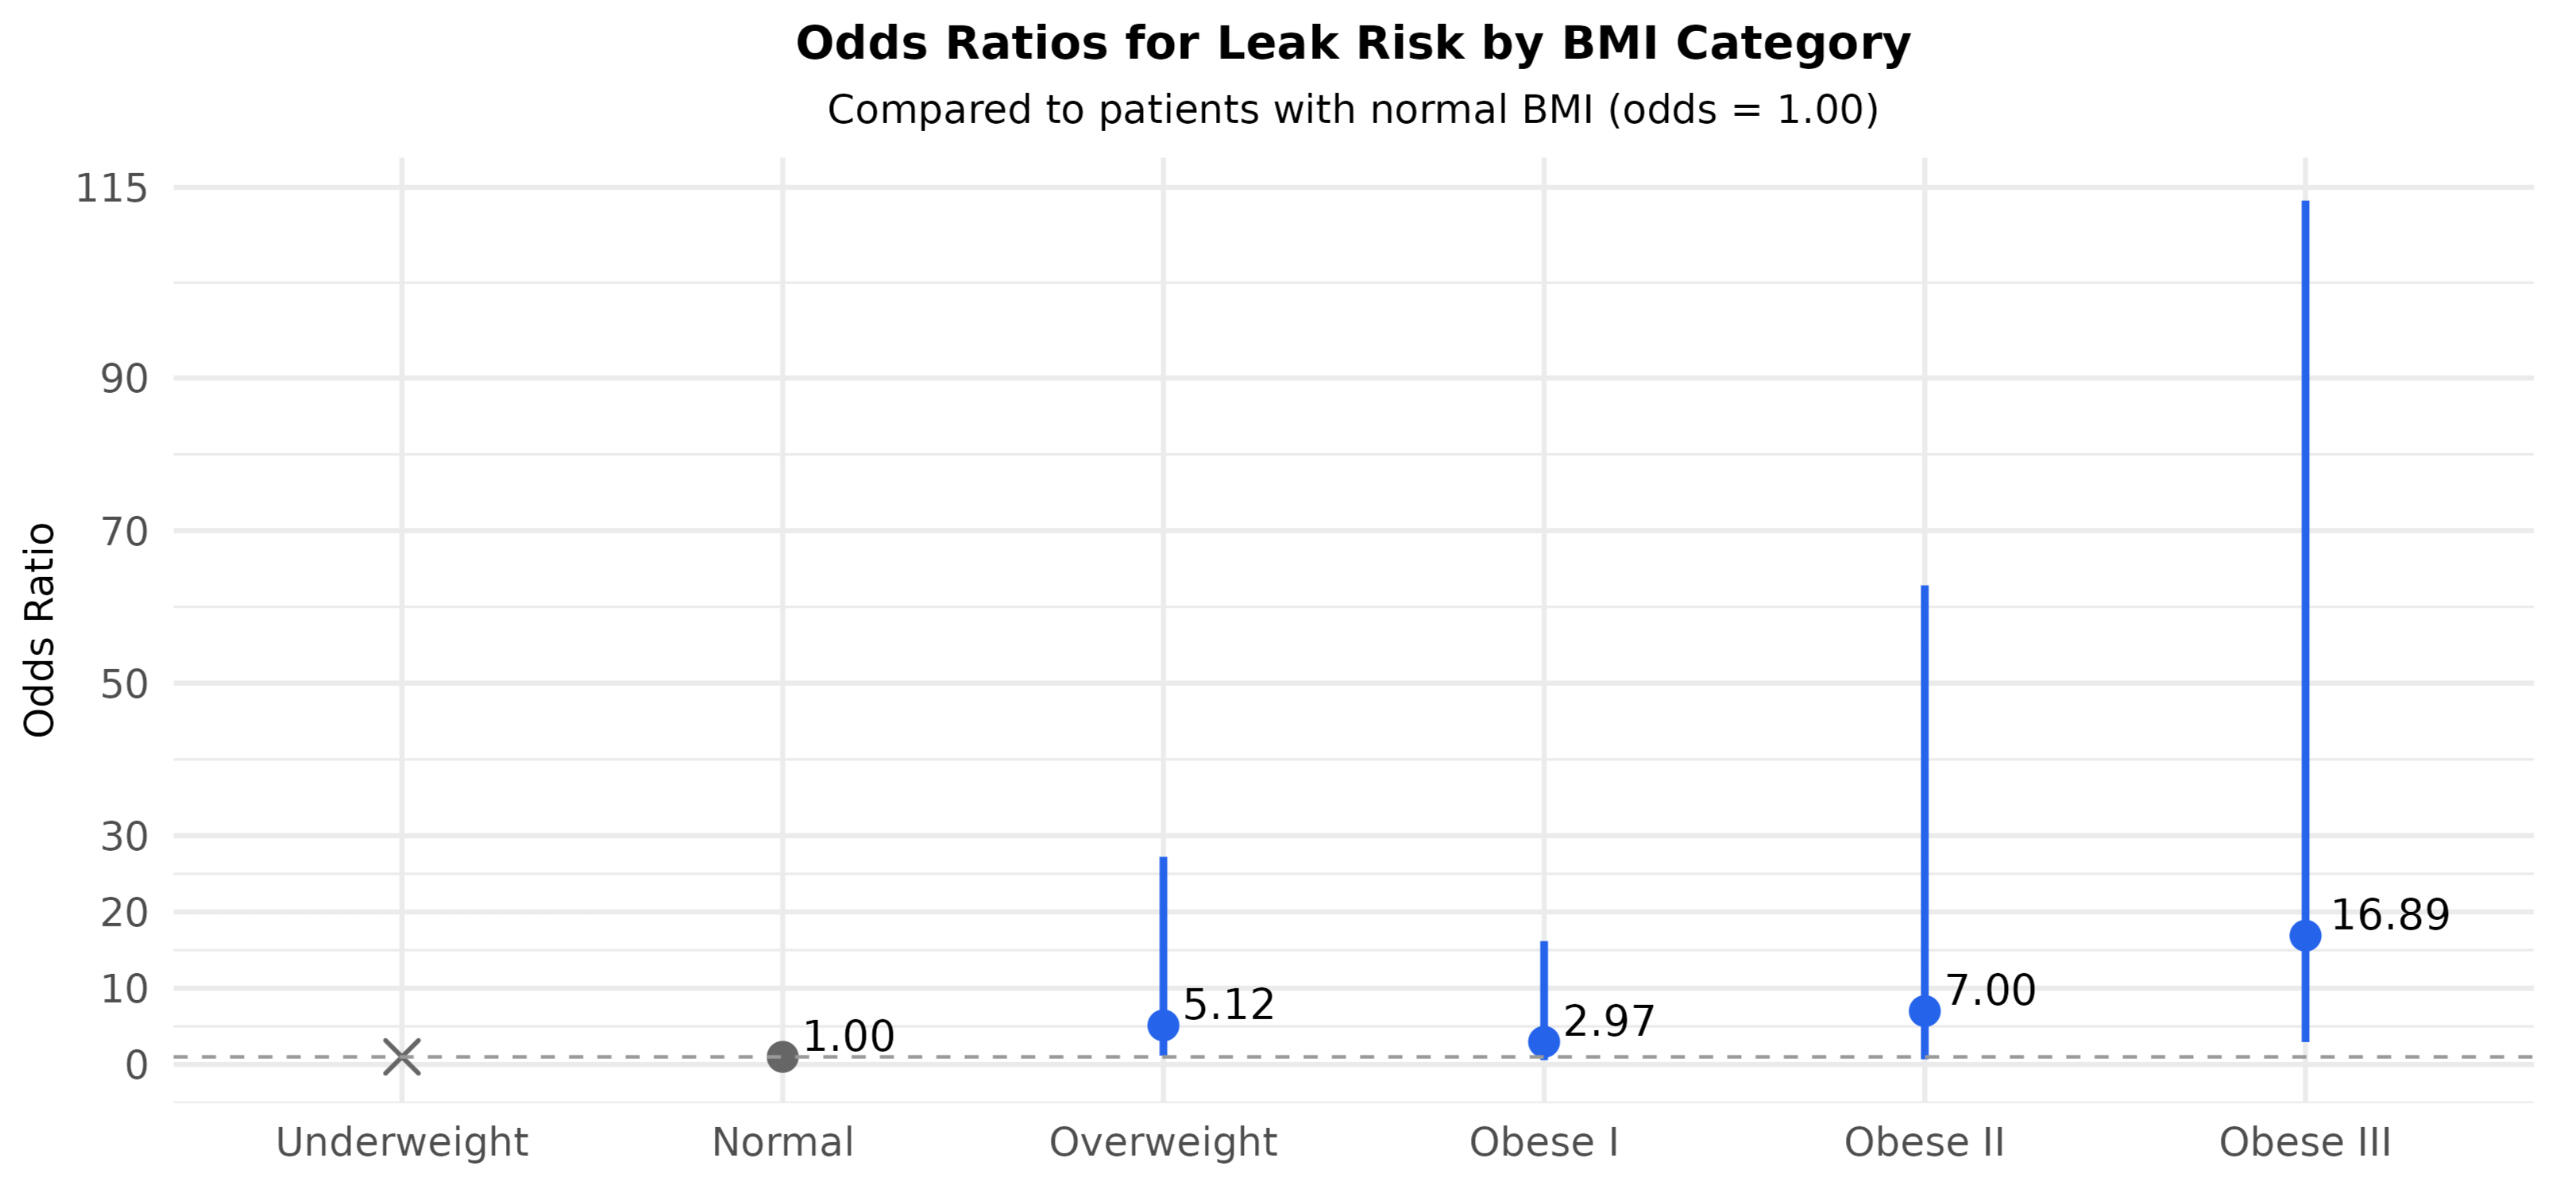
Figure 1 — Leak risk by BMI category (odds ratios, 95% CIs)
Odds ratios (OR) of anastomotic leak risk relative to Normal BMI. No leaks observed in Underweight group → OR not estimable (denoted with an X-shaped marker)
Patient profiles (what this means at the bedside)
Healthy 35-year-old, no comorbidities: Leak risk rises with BMI but remains <1% even at Obese III. (Figure 2)
High-risk 62-year-old, smoker, diabetic: Baseline risk ~15% at Normal BMI; ~75% at Obese III. (Figure 3)

Figure 2 — Predicted leak probabilities by BMI (healthy profile)
Risk remains low across the BMI spectrum. Bars labeled with exact probabilities; values <0.1% marked as “<0.1%” with minimum bar height.
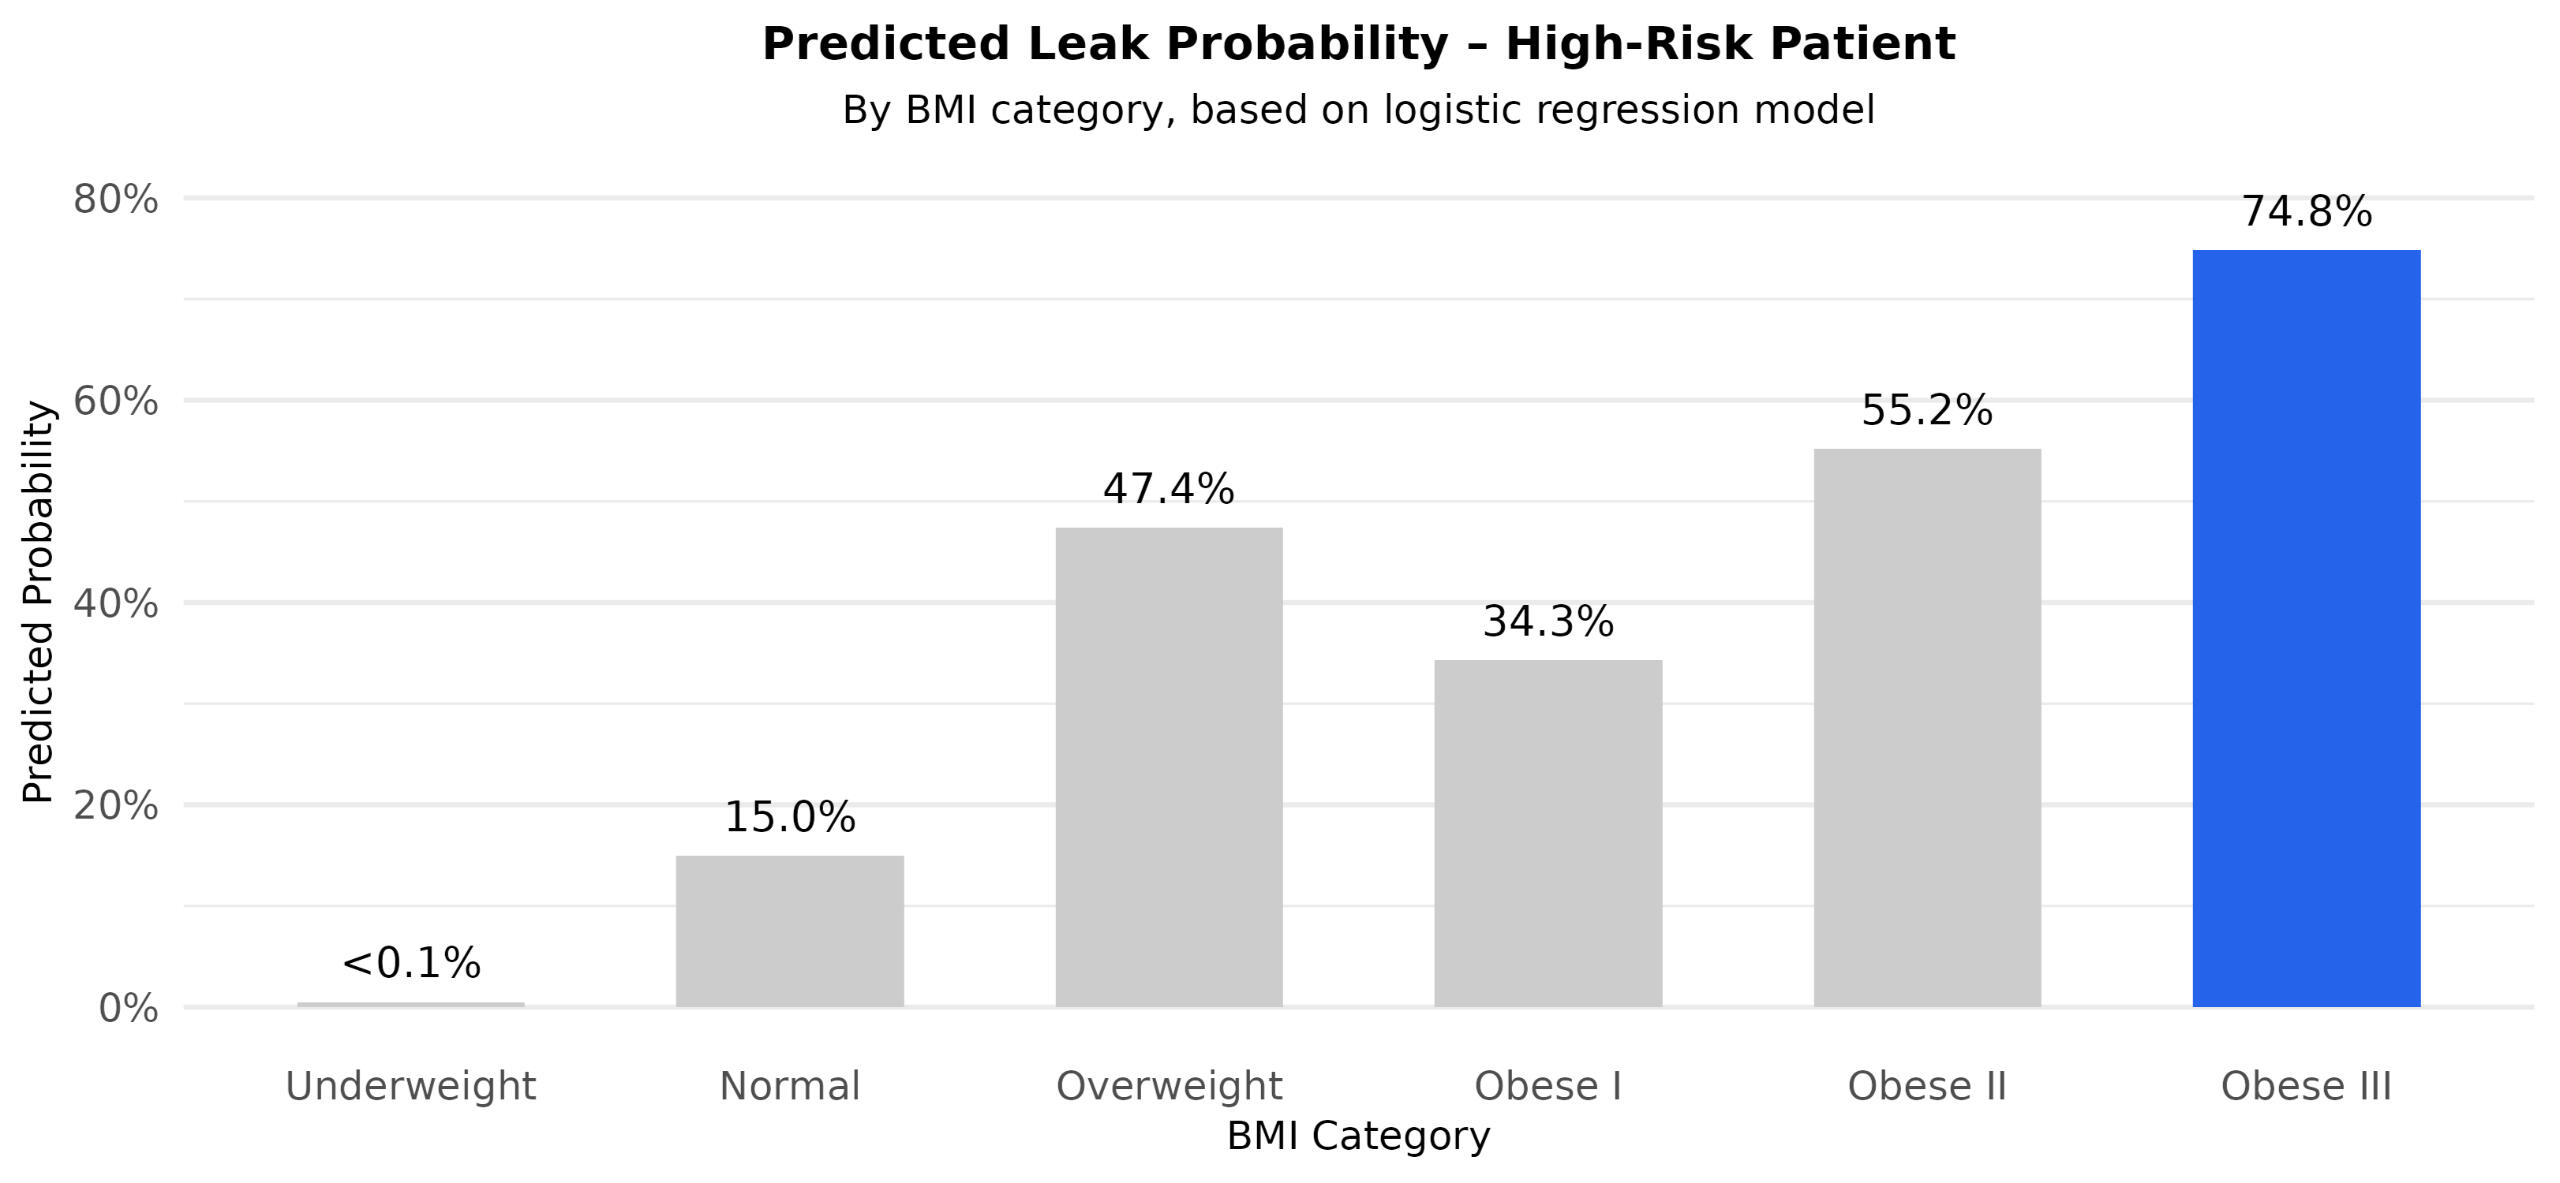
Figure 3 — Predicted leak probabilities by BMI (high-risk profile)
Risk increases substantially with higher BMI, reaching ~75% in the Obese III category. Bars labeled with exact probabilities; values <0.1% marked as “<0.1%” with minimum bar height.
Project context
Type: Independent applied research. Role: Lead analyst. Designed as a reproducible analysis. For client work, your data and artifacts remain yours and are never shared externally; no PII is required for this analysis. Access is read-only
For similar projects, I usually start with a brief intro call and a small pilot analysis. How I Work
Free · no prep needed.
Diaper Access—Equitable Hub Placement for Ventura County
Outcome
A defensible, data-backed hub location in south Oxnard near a major intercity transit hub that places:
~50% of Oxnard’s target population within a 30-minute walk, and
~30% of the county’s target population within a 30-minute bus ride.
This choice reflects the strong convergence of poverty and infant density and prioritizes walkability and transit access for underserved families.
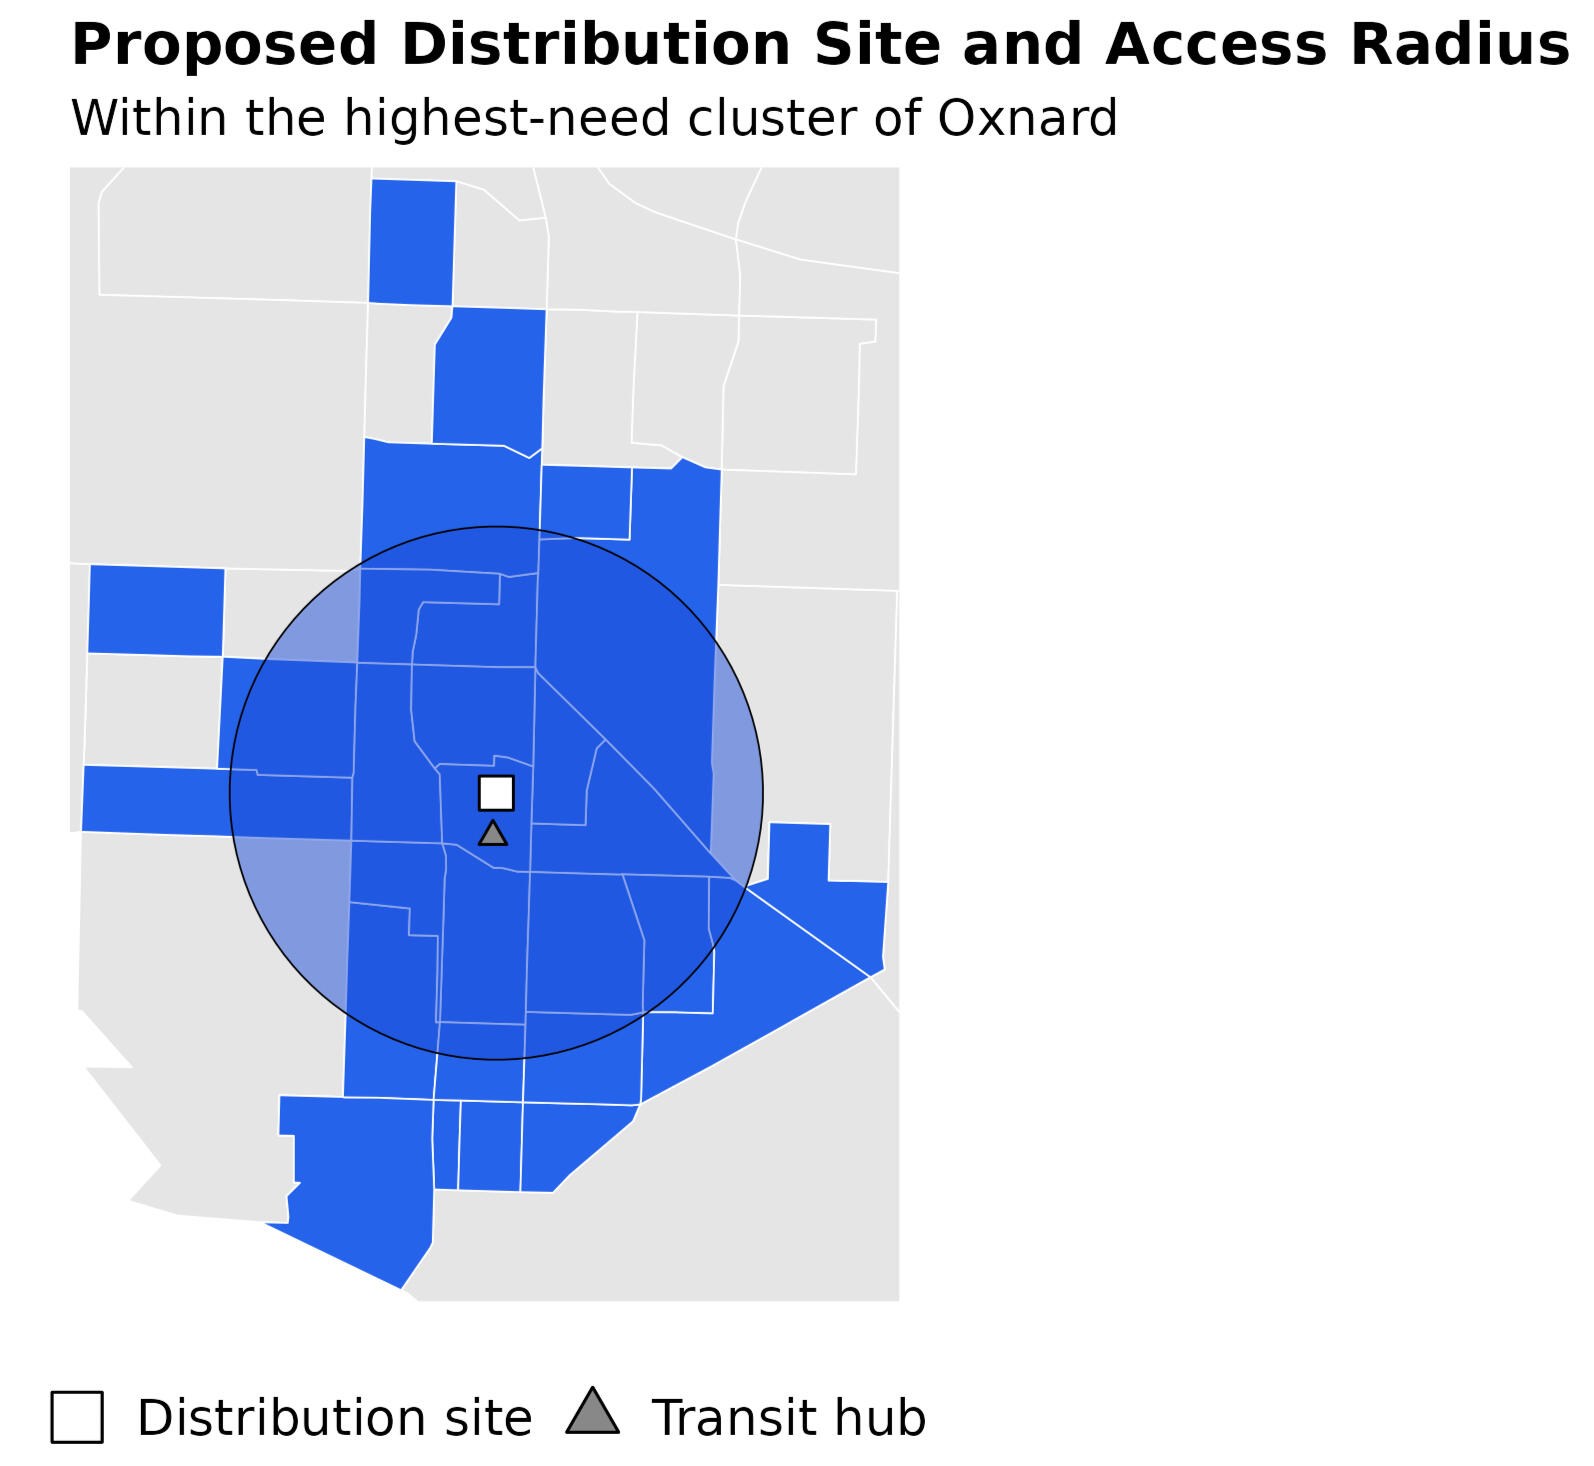
Figure 1 — Proposed site & access radius (walk) + transit hub
Zoomed Oxnard map showing candidate site (white square), intercity transit hub (gray triangle), and ~30-minute walk circle.
Research question
Where should a single diaper-distribution hub be sited to maximize equitable access—balancing poverty burden, infant population, and mobility constraints (walkability and transit)?
Approach
Compile U.S. Census indicators at the tract level: total population, infant population, poverty rate, tract area, and geography.
Use choropleth mapping to surface county-wide need patterns.
Focus analysis on Oxnard, where high poverty and infant density overlap most.
Apply K-means clustering on poverty rate, infant counts, and tract coordinates (lat/long) to identify high-need clusters.
Compute a data-weighted centroid of the top-need cluster (weights: infant population × poverty) to propose a candidate site.
Assess access via a 30-minute walk radius and 30-minute bus reach anchored on proximity to the intercity transit hub.
Technical note: Tract features standardized prior to K-means; coordinate features handled in a projected CRS for distance stability. Cluster count chosen via elbow/silhouette checks. Access metrics reported as coverage shares (target population within isochrones/thresholds).
Findings
County view: Poverty and infant density jointly highlight Oxnard as the principal locus of need.
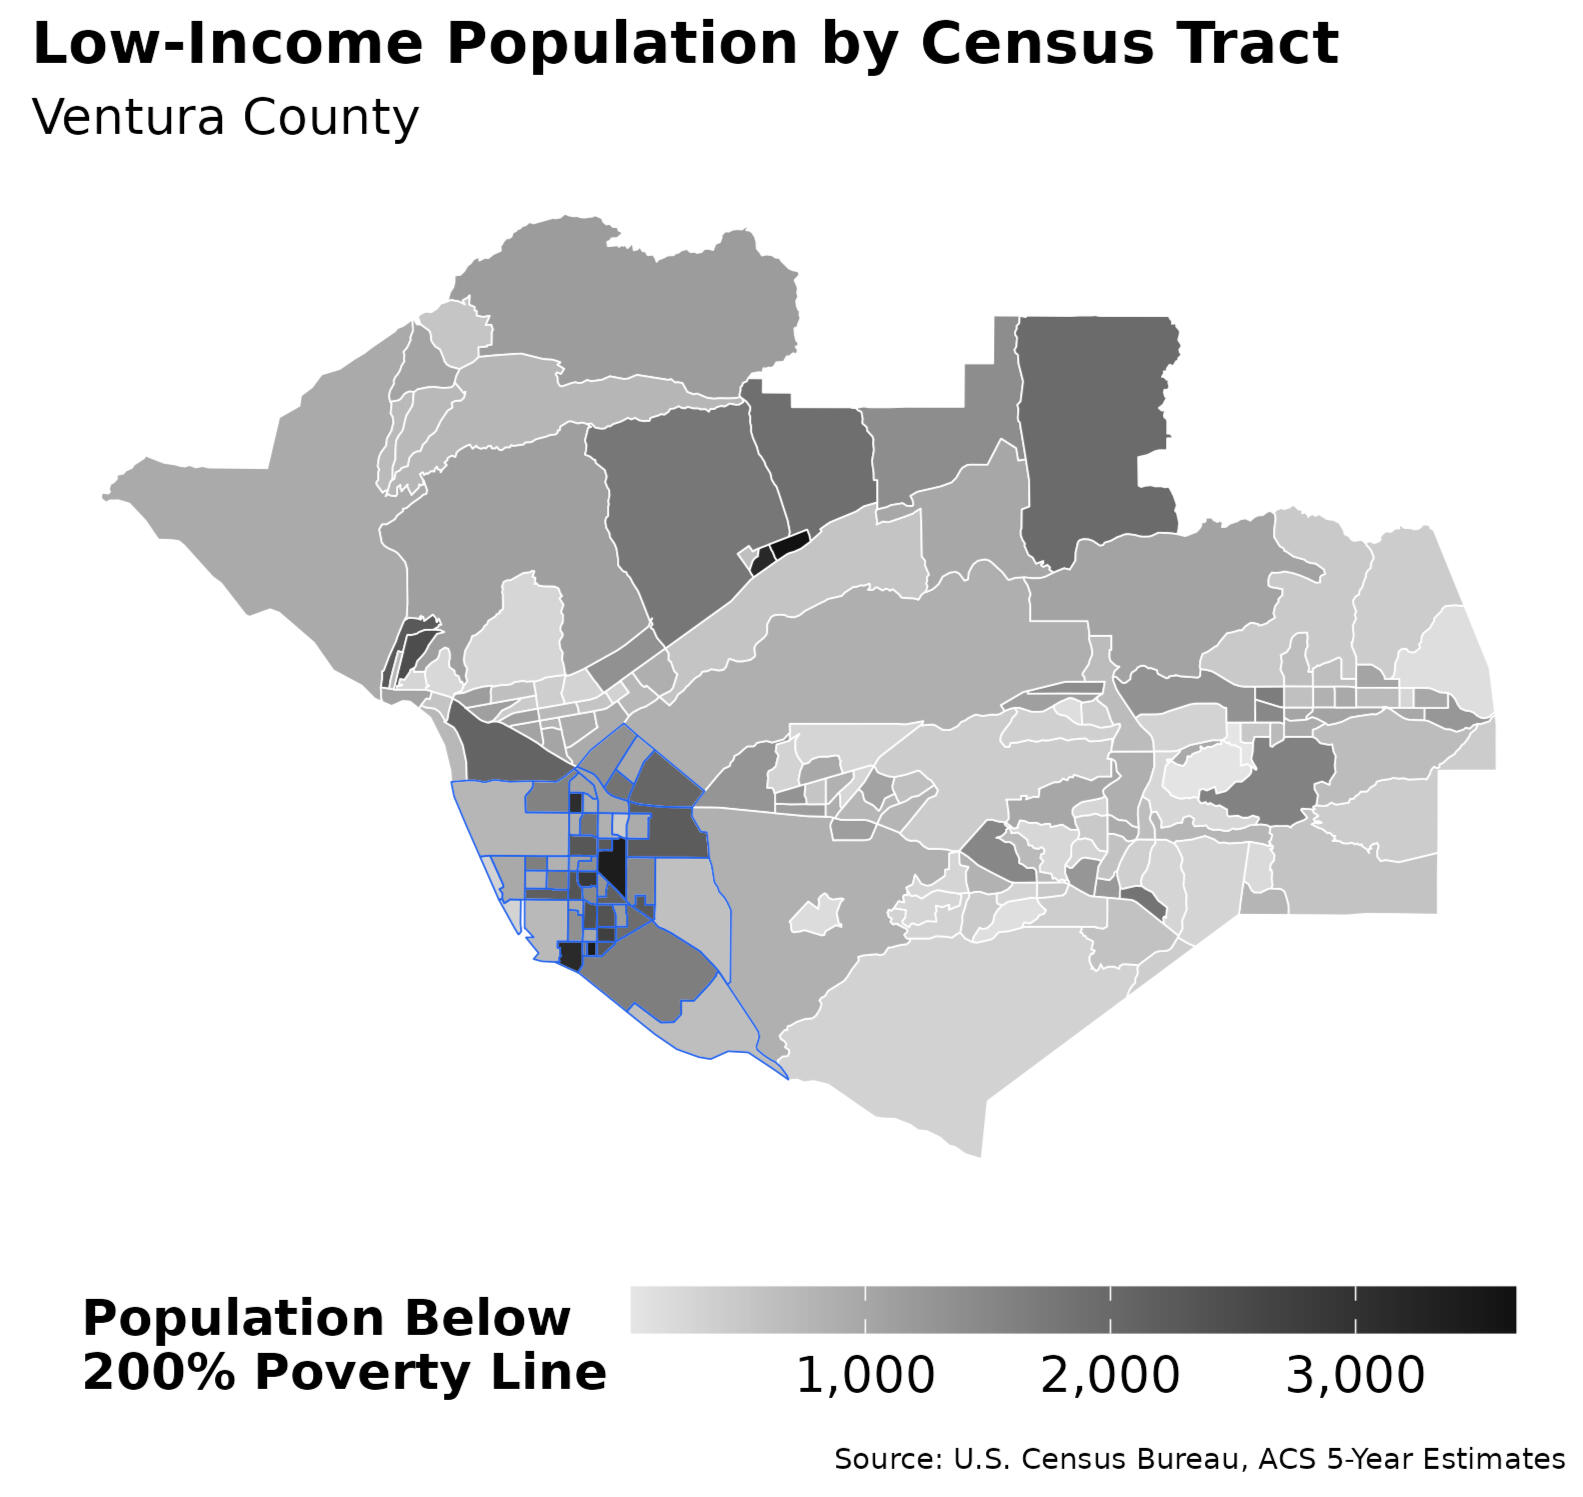
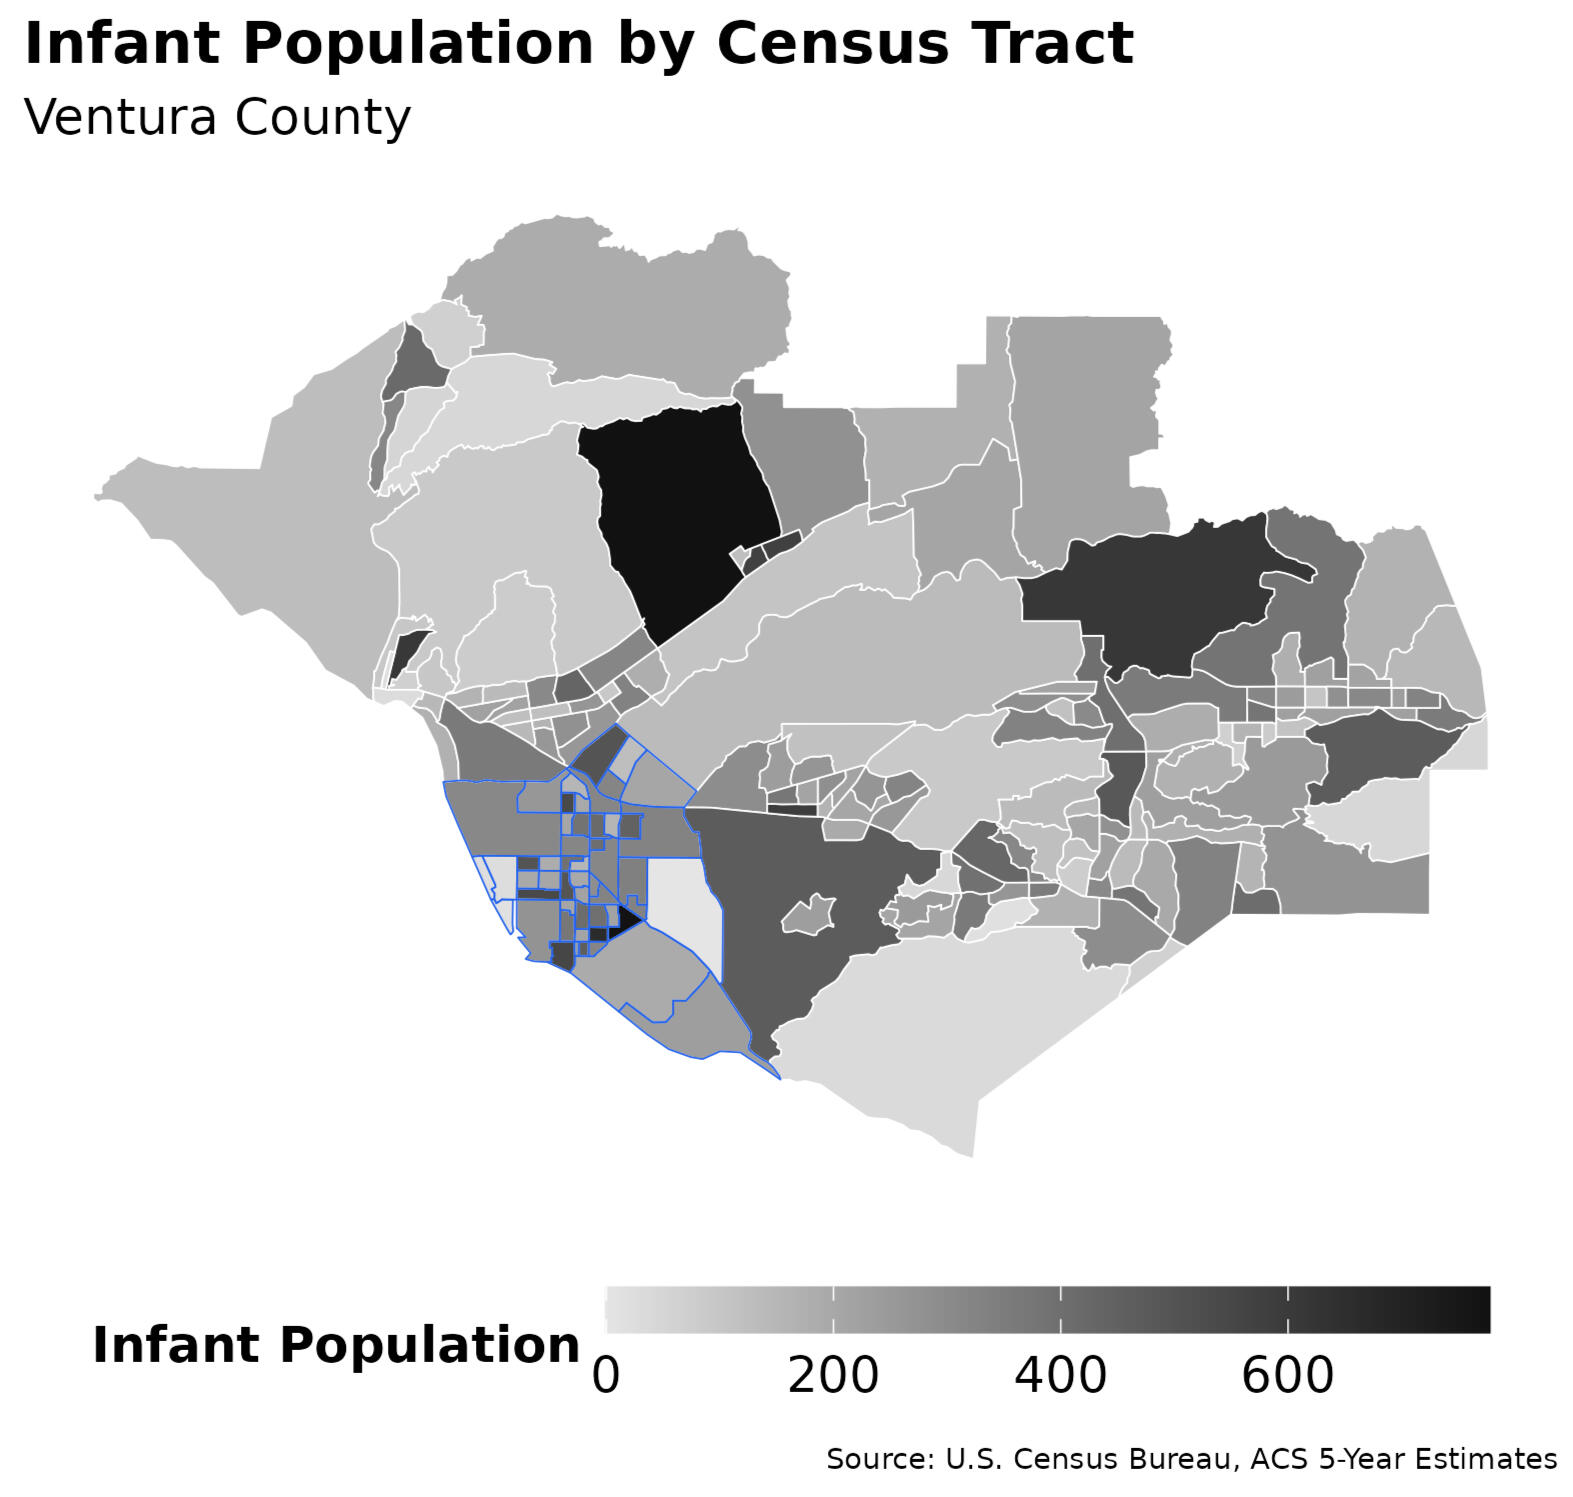
Figure 2 & Figure 3 — County indicators (poverty & infant population)
Side-by-side shaded tract maps showing population under 200% Federal Poverty Level (Figure 2) and infant population (Figure 3). Together, they highlight a strong convergence of need in the city of Oxnard.
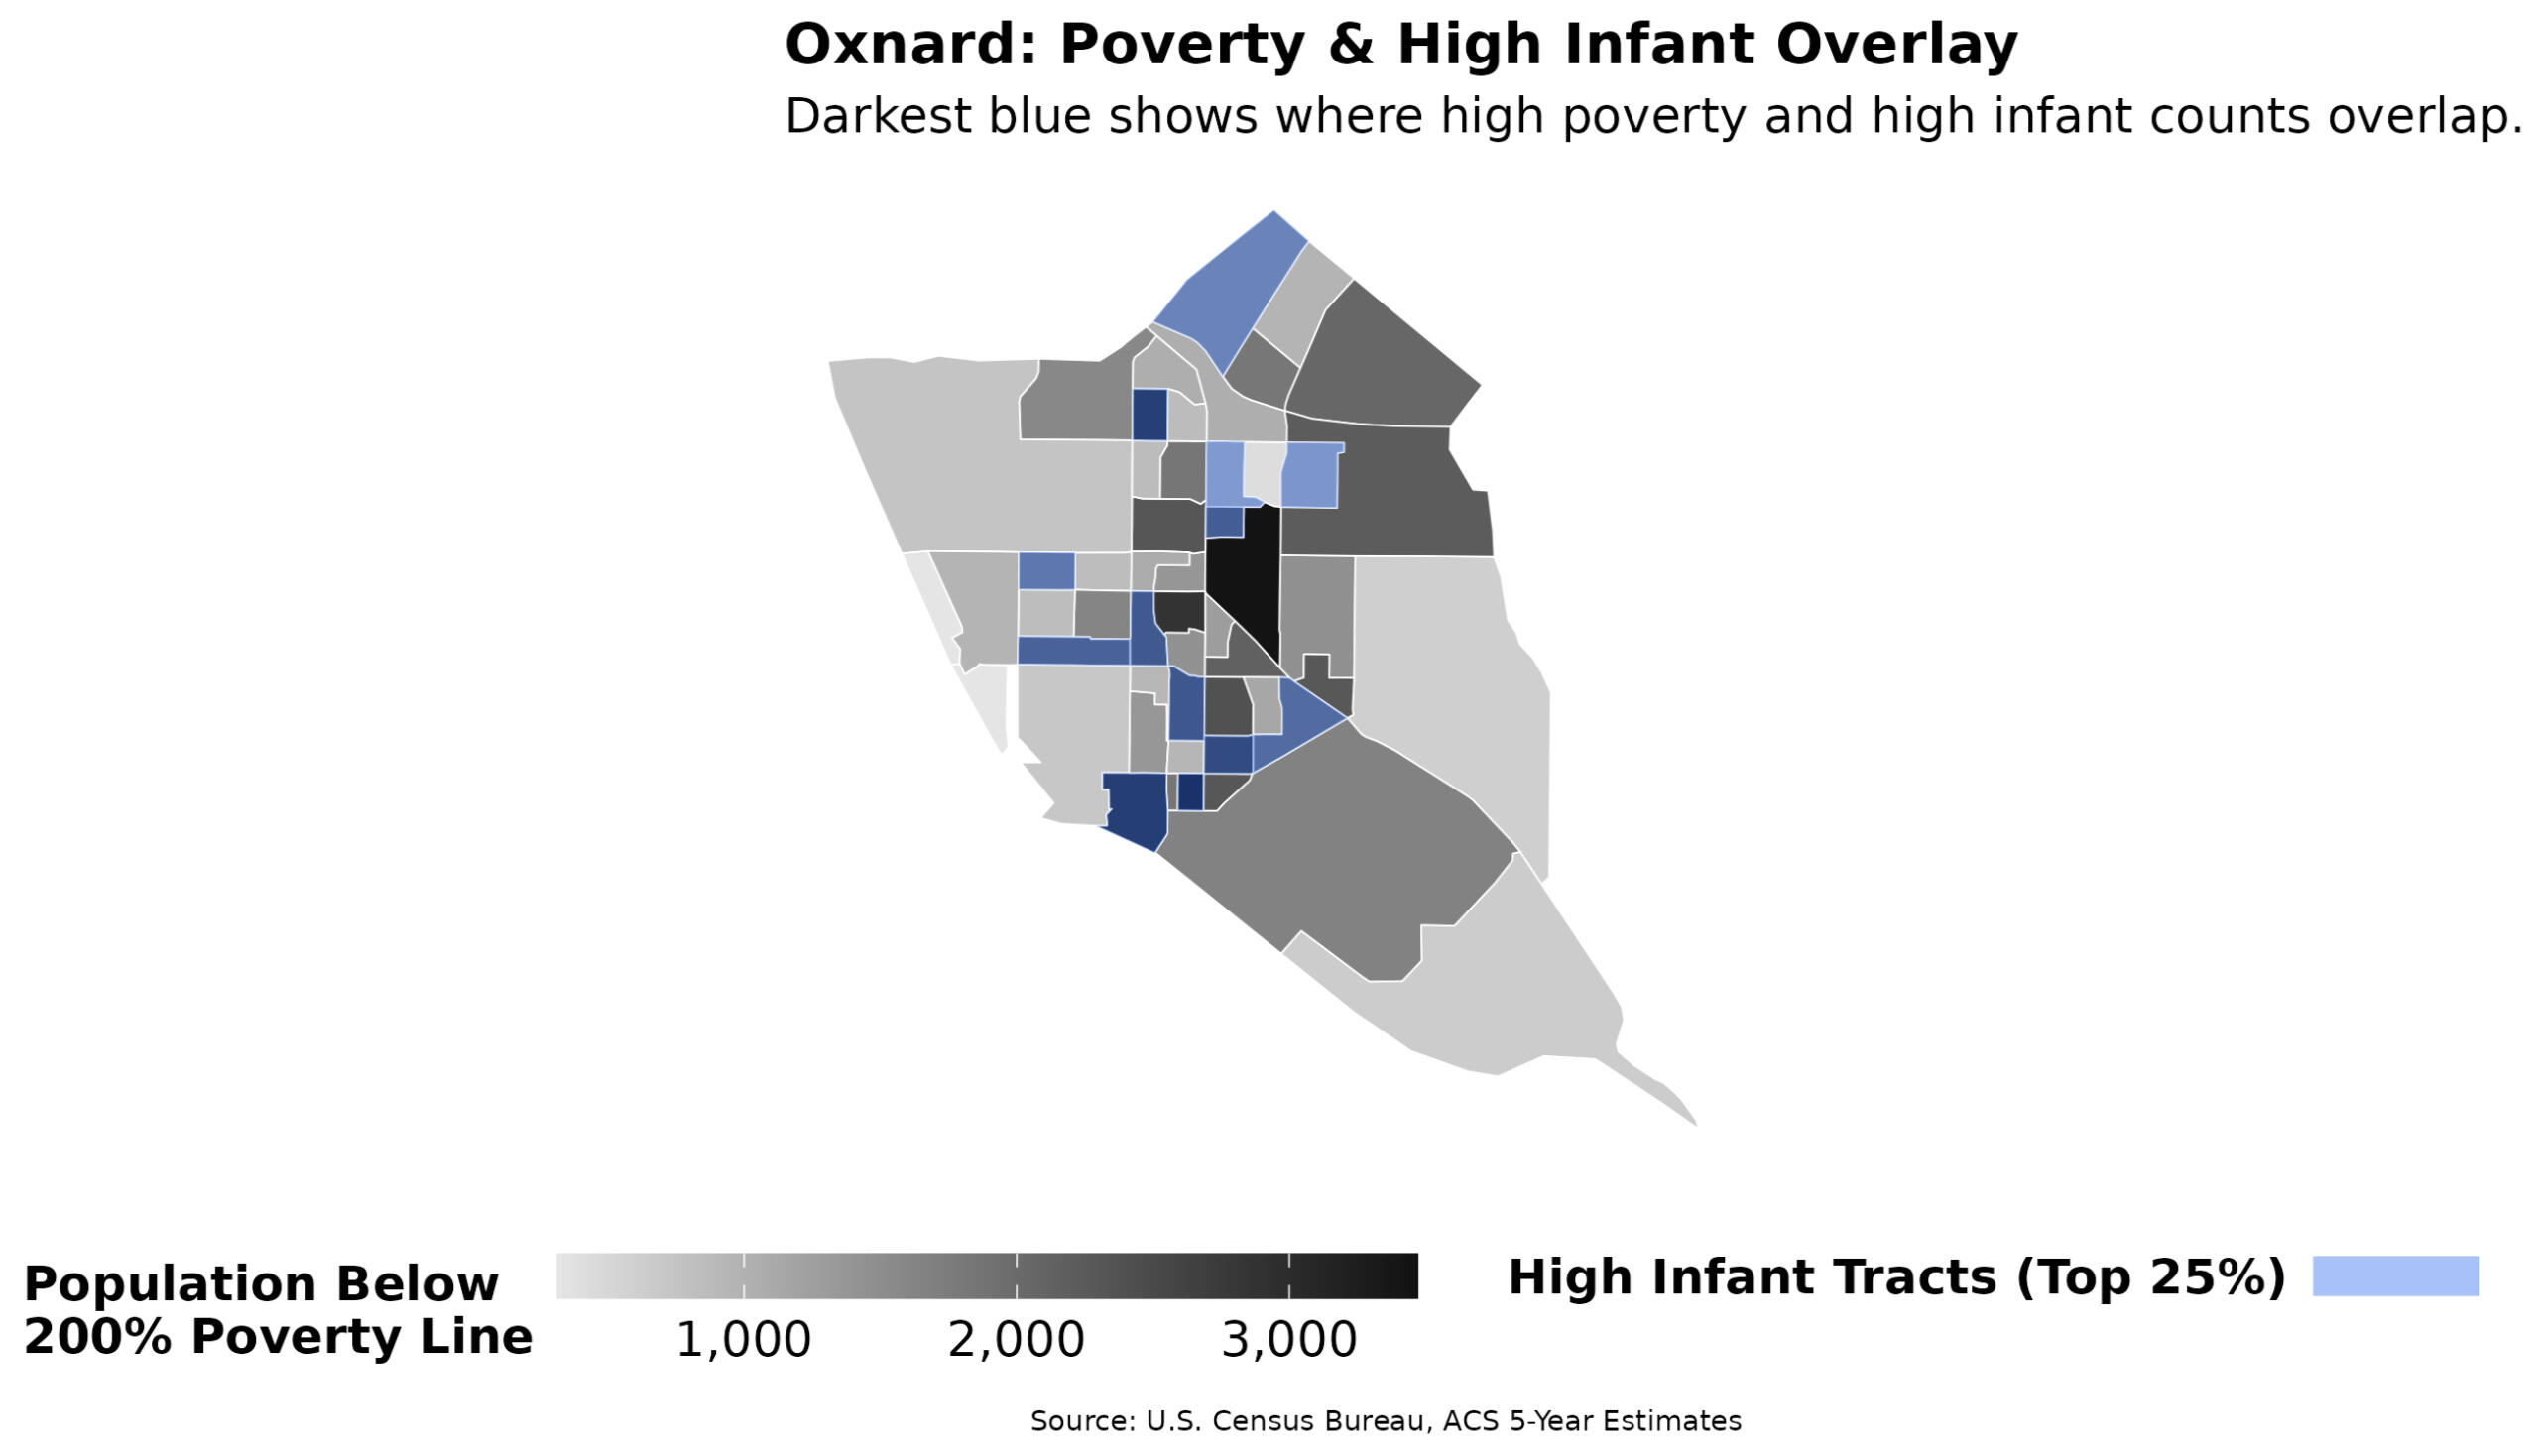
Figure 4 — Oxnard high-need zones (poverty + high-infant tracts)
Tracts ranking in the top 25% of infant population (blue) overlaid on a poverty-rate map. The convergence of these two indicators identifies the core neighborhoods most in need of service access.
Oxnard focus: K-means identifies a central/south Oxnard cluster as highest need.
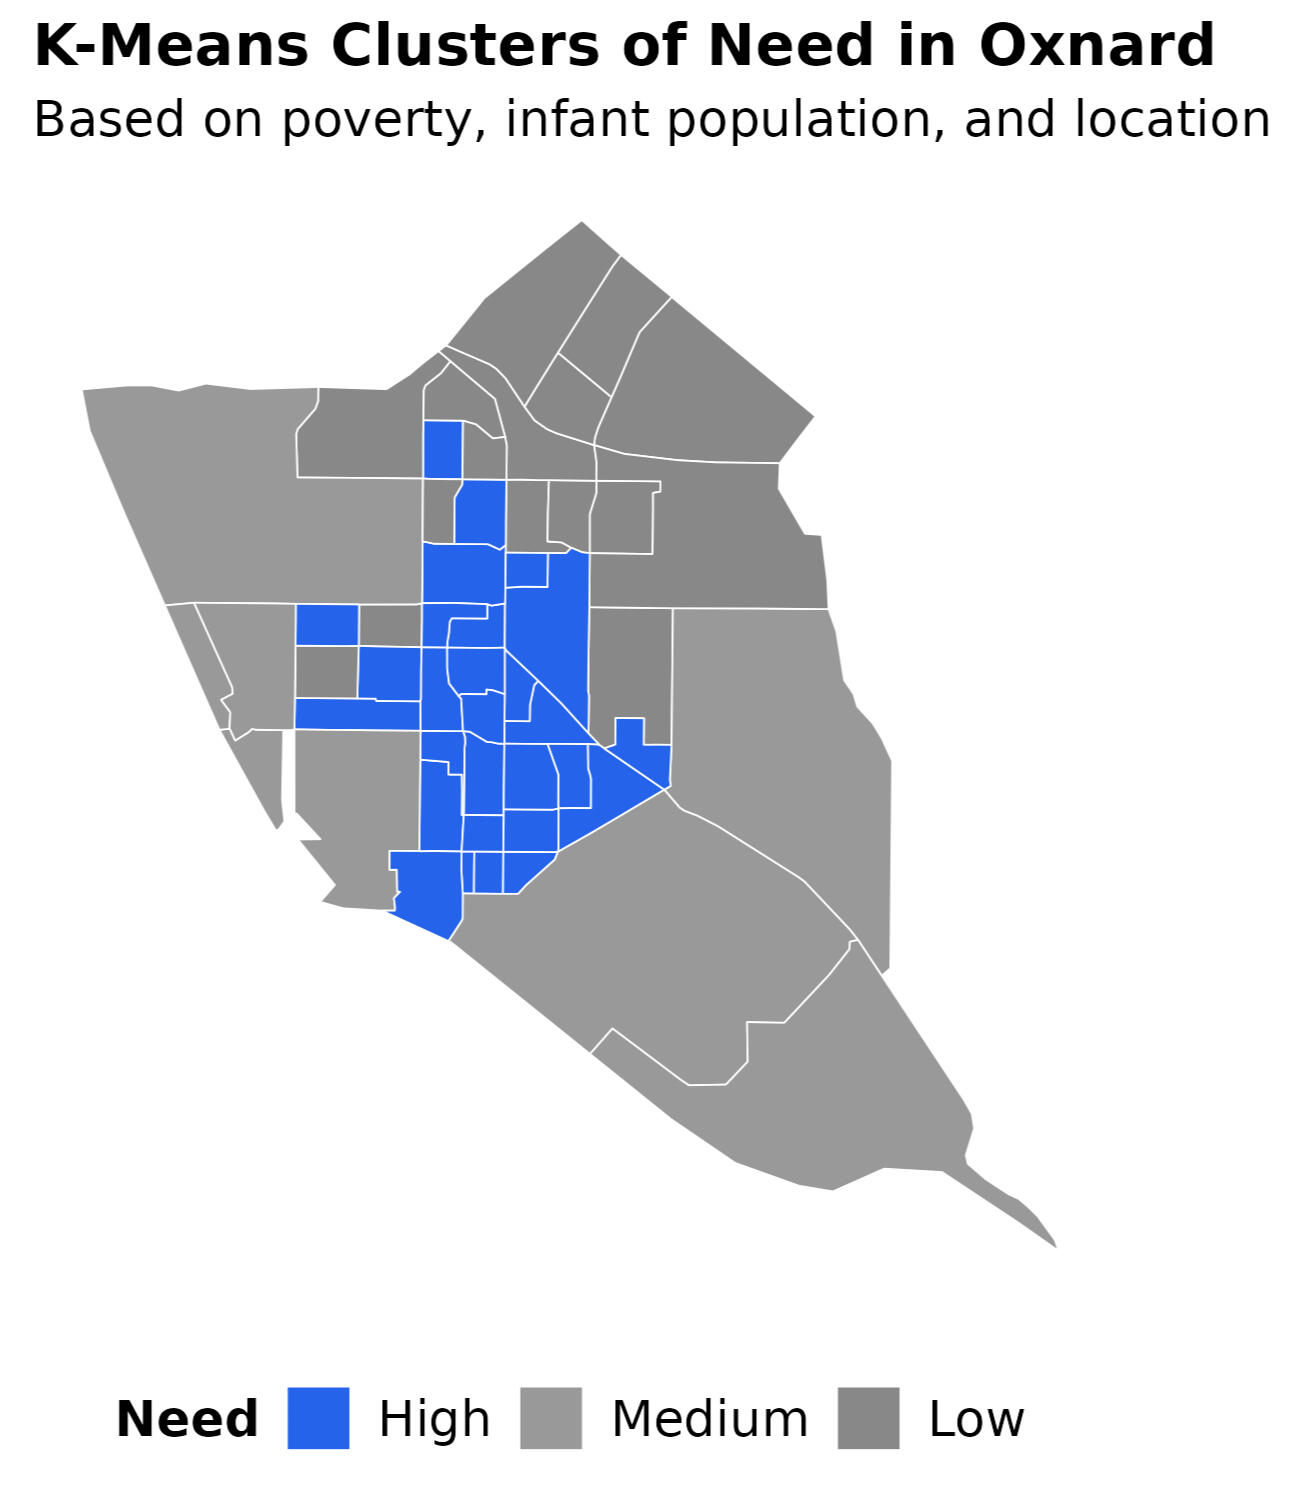
Figure 5 — K-means clusters of need (Oxnard)
The highest-need cluster (in blue) includes central/south Oxnard neighborhoods. Tracts colored by cluster using poverty, infants, and location.
Proposed site: The weighted centroid falls in south Oxnard, adjacent to a major intercity transit hub.
Access impact:
Walkability: ~50% of Oxnard’s target population within 30 minutes on foot.
Transit: ~30% of the county’s target population reachable within 30 minutes by bus.
Equity read: The site lies inside overlapping high-infant population and high-poverty tracts, aligning service with concentrated need while improving first-mile access.
Project context
Type: Independent applied research. Role: Lead analyst. Designed as a reproducible analysis. For client work, your data and artifacts remain yours and are never shared externally; no PII is required for this analysis. Access is read-only
For similar projects, I usually start with a brief intro call and a small pilot analysis. How I Work
Free · no prep needed.
Reverse-Engineering Laser Systems with Invertible Neural Networks
This work was part of a collaboration with a physics research group at The Ohio State University and was supported by the National Science Foundation.
Outcome
A credible inverse model that infers viable laser parameter sets directly from desired proton energy spectra—avoiding exhaustive brute-force search. When inferred parameters are re-simulated through the physics forward model, the target energy outputs are reproduced with ~95% accuracy across total, maximum, and average proton-energy metrics, enabling rapid design-space exploration for experiment planning.
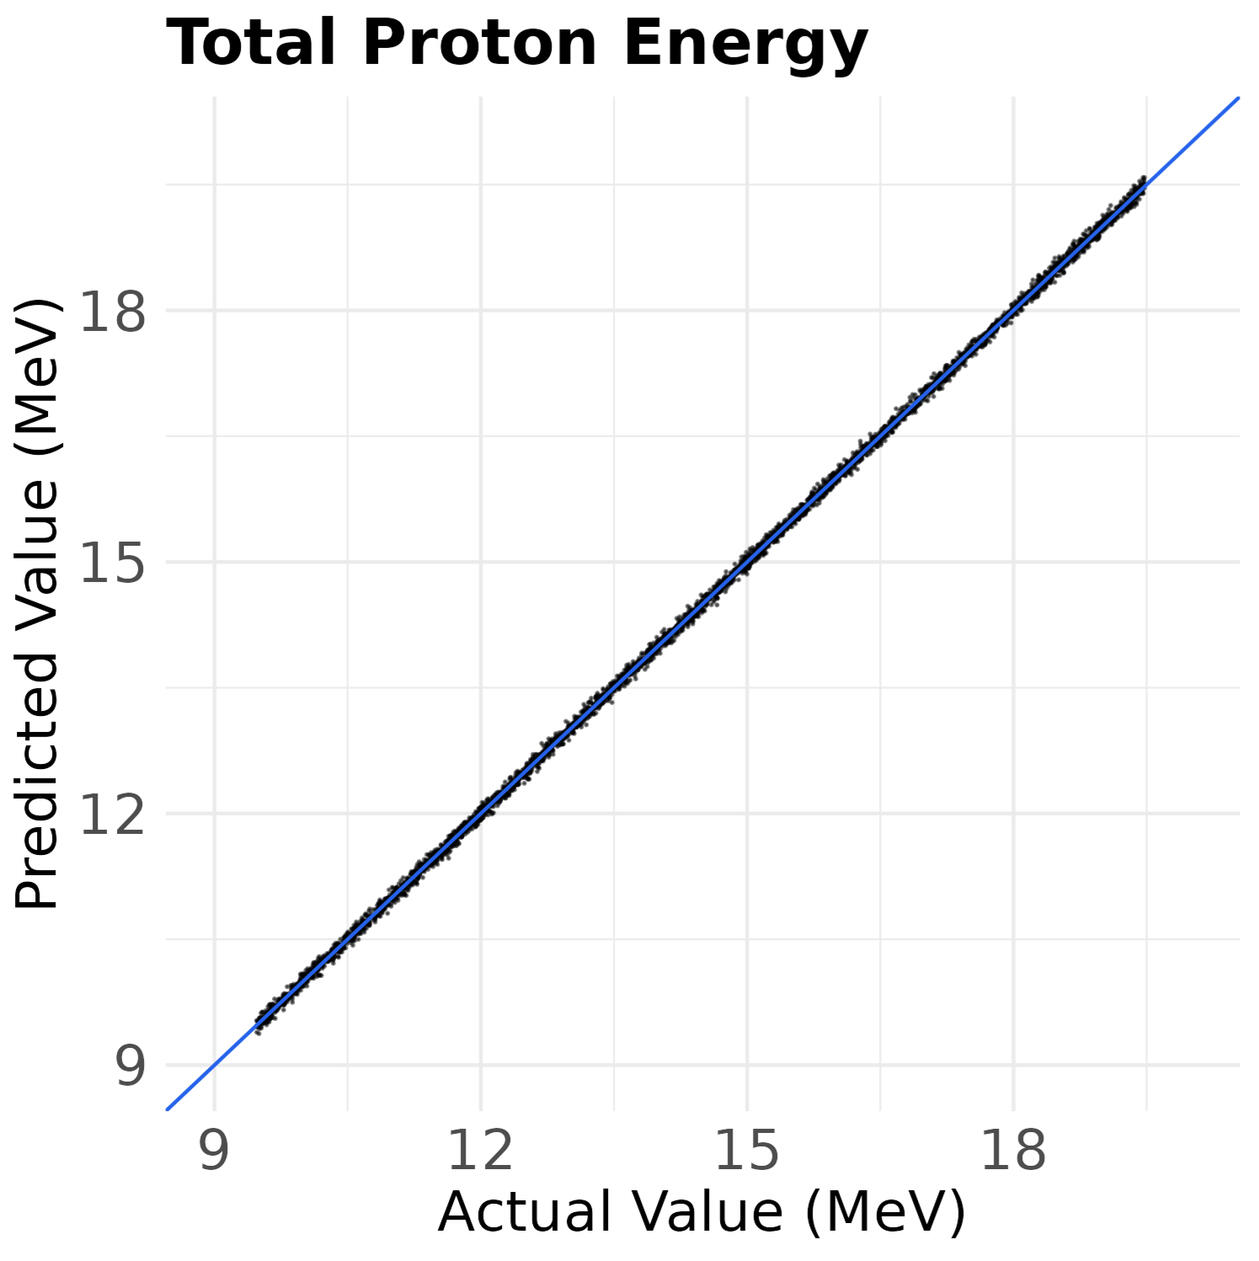


Figure 1 — Predicted vs target energy metrics (total, max, average)
Points (in black) represent reconstructed energy values generated from inferred laser parameters; 45° blue line indicates perfect agreement.
Note: Points and axis tick values are shown on the log(energy) scale for clarity.
Research question
Can we recover laser settings that achieve specified proton energy targets quickly and defensibly—without scanning millions of configurations—and do so in a way scientists can validate and trust?
Approach
Train an Invertible Neural Network (INN) to learn a non-bijective mapping between laser parameters ↔ proton spectra using a physics-based forward model to generate paired simulations.
Use exact inversion to sample plausible parameter sets given a target spectrum, then re-simulate via the original physics model to verify outputs.
Embrace the many-to-one nature of the inverse problem by producing ensembles of solutions rather than a single point estimate.
Technical note: Coupling-layer INN with change-of-variables training; losses incorporate forward-consistency and inverse-consistency. Inputs/outputs standardized; prior bounds enforced on physical parameters. Evaluation uses re-simulation agreement.
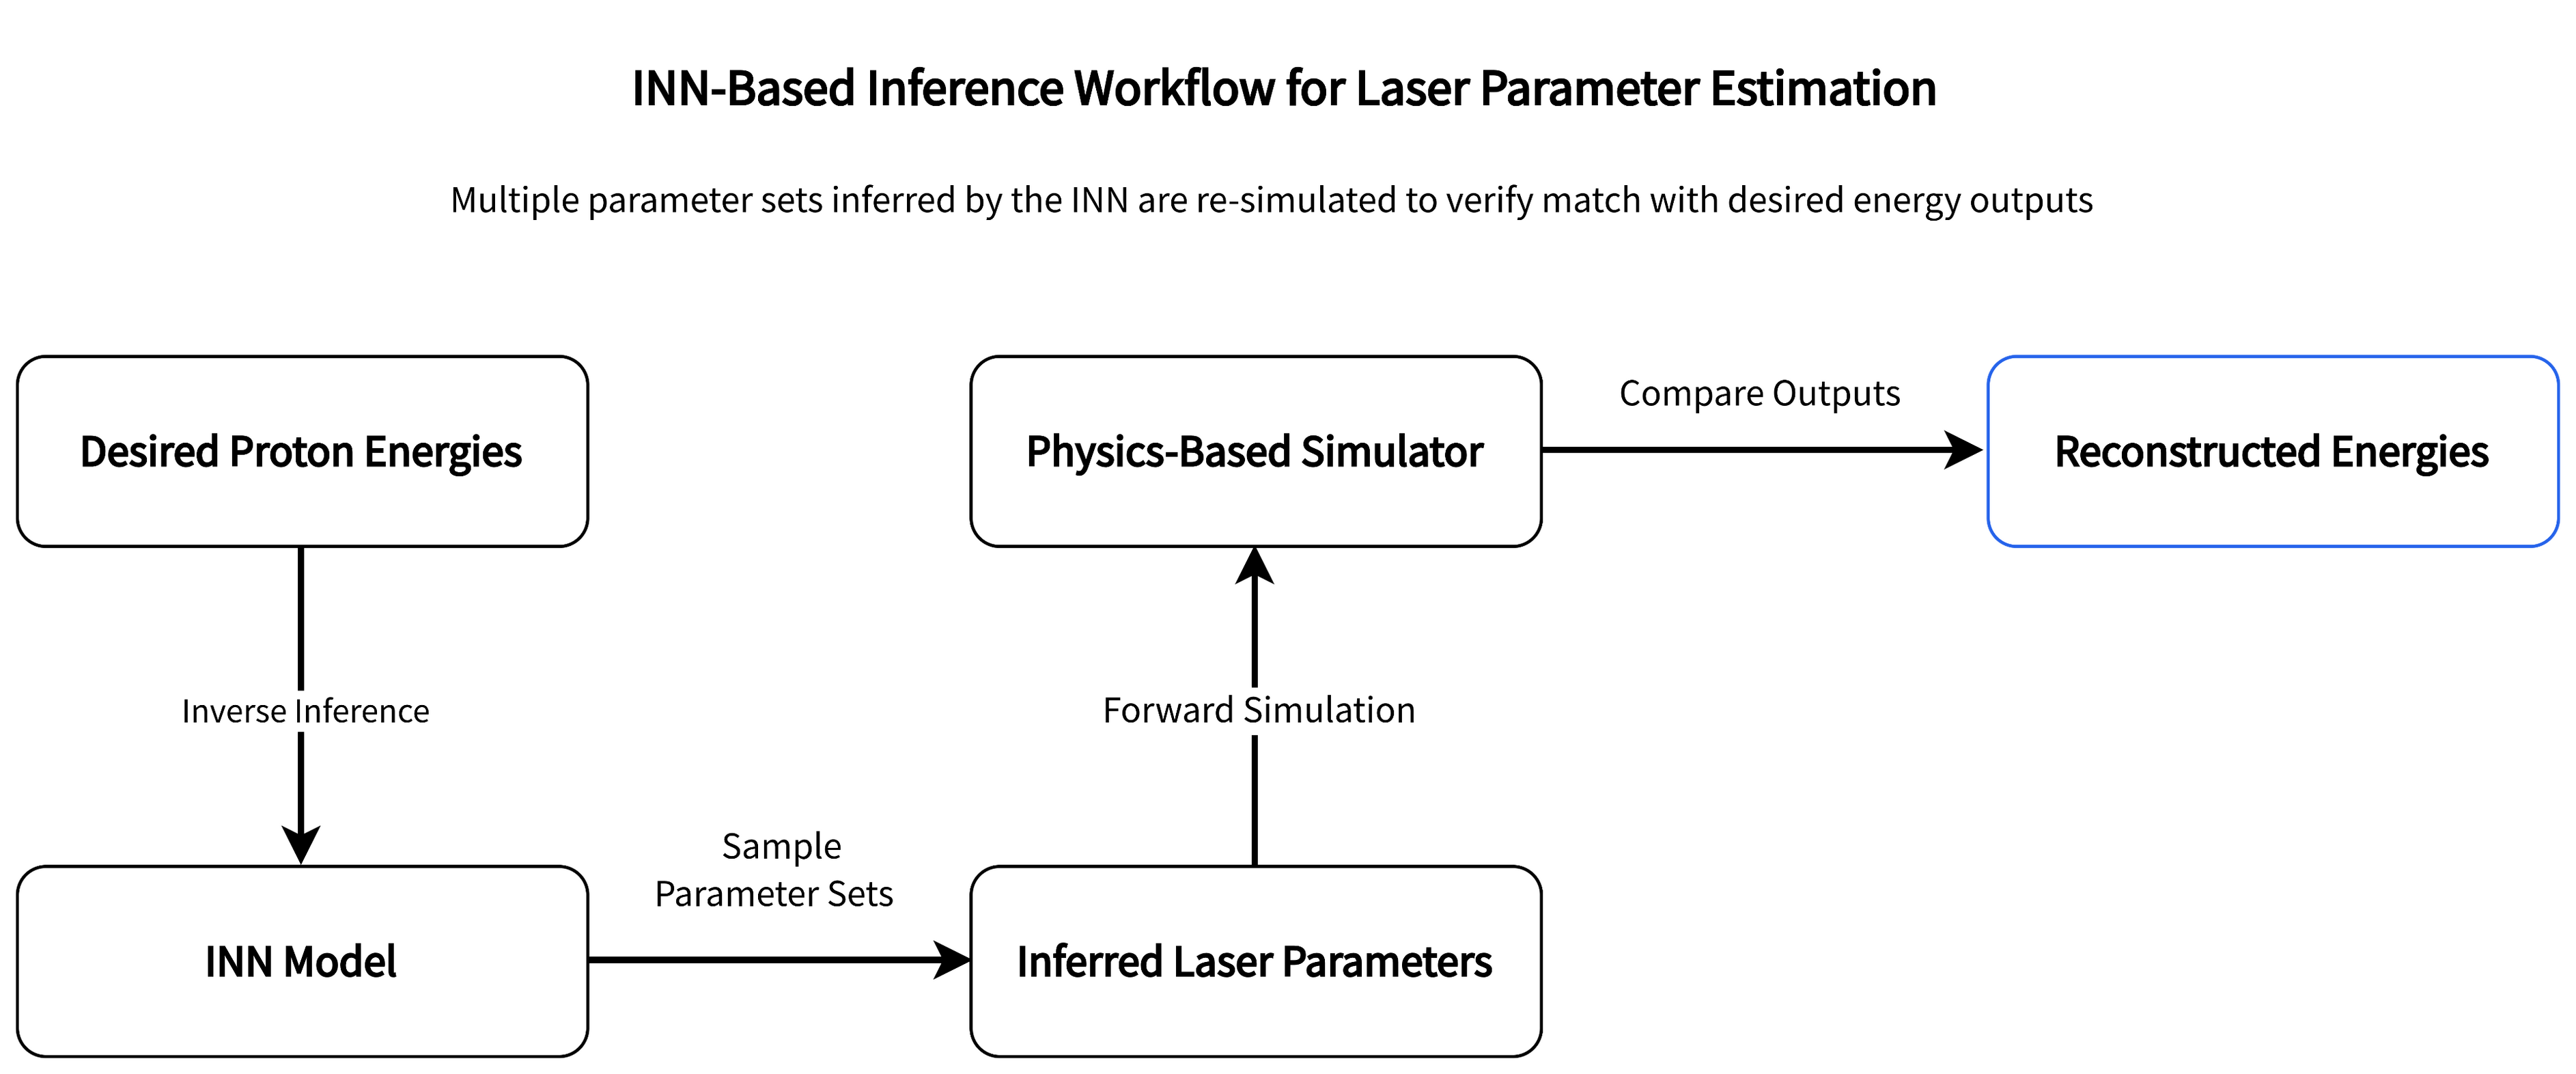
Figure 2 — Inverse-model workflow (INN → laser parameters → physics re-sim)
The INN receives desired energy outputs and generates plausible laser parameter sets, which are validated by re-simulating through a physics-based model.
Findings
The INN reconstructs target spectra reliably when inferred parameters are re-simulated, achieving ~95% agreement across total, maximum, and average energy metrics.
The method identifies multiple valid configurations that meet the same target—useful when operational constraints (e.g., safety limits, hardware ranges) need flexibility.
Compared with brute-force searches, the inverse model materially reduces compute/search effort, enabling faster iteration in experimental planning.
Project context
Type: Collaborative applied research. Role: Lead Analyst. Designed as a reproducible analysis. For client work, your data and artifacts remain yours and are never shared externally; no PII is required for this analysis. Access is read-only
Collaboration & support: Conducted with a physics research group at The Ohio State University; supported by the National Science Foundation.
For similar projects, I usually start with a brief intro call and a small pilot analysis. How I Work
Free · no prep needed.
Error Modeling for High-Velocity Tracking Systems
Outcome
A nonparametric model that captures a highly nonlinear, oscillatory error pattern with growing amplitude over distance, delivering usable prediction intervals at operational ranges. This supports real-time targeting adjustments with defensible uncertainty bands and avoids misleading extrapolation beyond the validated range (0–8 km).
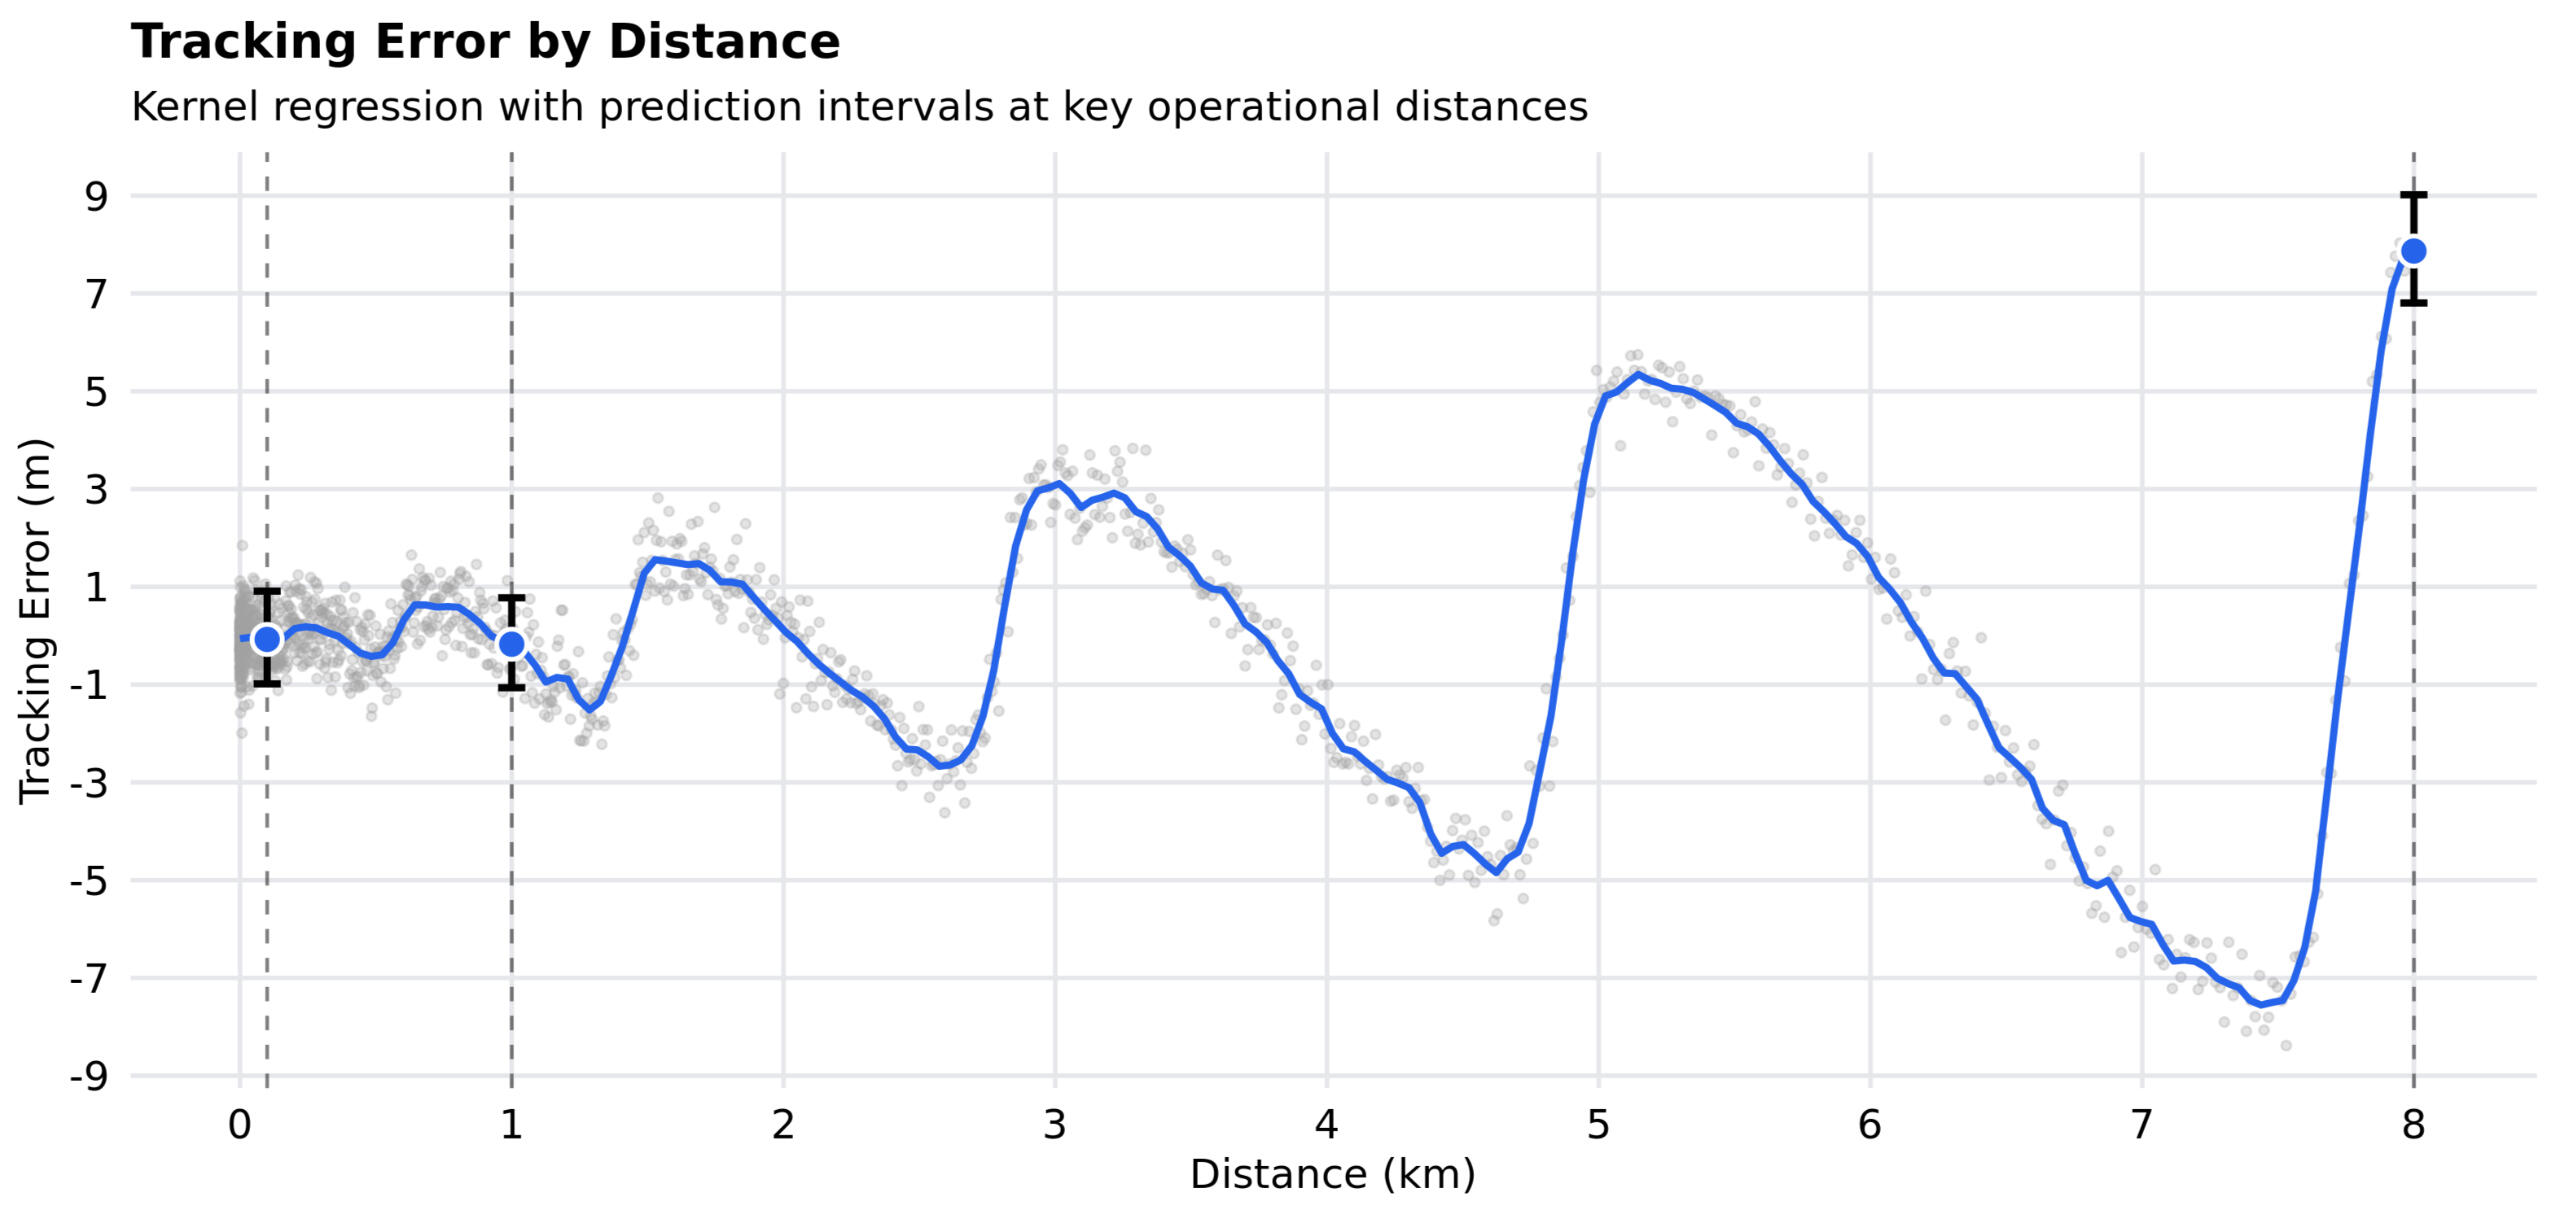
Figure 1 — Tracking error vs distance
Kernel regression estimates of error from 0 to 8 km (blue line). Vertical bars represent prediction intervals of positioning error at 0.1, 1.0, and 8.0 km. The shape of the model reflects the highly nonlinearity, oscillatory error pattern in the observed data (gray points).
Research question
How does tracking error evolve with distance in fast-tracking scenarios, and can we provide distance-specific prediction intervals to guide tuning and guardrails during live operations?
Approach
Diagnose shape: exploratory plots revealed wave-like, amplitude-increasing error vs. distance and heteroskedasticity.
Fit nonparametric kernel regression (no imposed functional form) to capture oscillation and local curvature.
Quantify uncertainty at 0.1 km, 1.0 km, and 8.0 km using bootstrap resampling of residuals, producing prediction intervals at critical ranges.
Enforce no extrapolation beyond 8.0 km (training support), where uncertainty balloons.
Technical note: Local-weighted kernel smoother with bandwidth tuned by out-of-sample error; residual bootstrap for PIs; caution flags for boundary regions; results reported on the original meter scale.
Findings
Average error ≈ 0.5 m over the validated range, with distance-specific prediction intervals of tracking error:
0.1 km: −0.99 m to 0.91 m
1.0 km: −1.06 m to 0.77 m
8.0 km: 6.81 m to 9.02 m (clear growth in magnitude at range)
The oscillatory structure (growing amplitude) is captured without over-smoothing, yielding more realistic bounds than polynomial or linear fits would provide.
Operational guidance: tighten tolerances at short range; apply wider, distance-aware guardrails as range increases; avoid decisions that rely on predictions beyond 8 km absent new data.
Project context
Type: Collaborative applied research. Role: Lead Analyst. Designed as a reproducible analysis. For client work, your data and artifacts remain yours and are never shared externally; no PII is required for this analysis. Access is read-only
For similar projects, I usually start with a brief intro call and a small pilot analysis. How I Work
Free · no prep needed.